INST Committee Report
If you have any questions or comments regarding the accessibility of this publication, please contact us at accessible@parl.gc.ca.
This chapter covers the Committee’s review of the data on gasoline prices — retail, rack and crude.1 The focus is on the most recent past, from November 2002 to September 2003, in order to understand the factors that led to the highest gasoline prices ever in Canada.2 Longer term and international perspectives are also examined, however. Explanations for these soaring prices, including their timing, are discussed in Chapter 3.
Gasoline and Crude Oil Prices (November 2002–September 2003)
The Committee begins its study of gasoline prices with the price of crude oil, the primary raw material of gasoline. As the best indicator of crude oil prices, the Committee uses the industry’s traditional North American benchmark price of West Texas Intermediate (WTI) crude oil as established by the New York Mercantile Exchange (NYMEX). On November 11, 2002, the closing price of WTI crude on the NYMEX was US$26.42 per barrel — neither a high nor a low for that year (see Figure 1). This price rose steadily to a high of US$36.96 on February 18, 2003 — a 40% increase in just three months — before falling precipitously to US$26.91 on March 25, 2003, a drop of more than US$10 per barrel in just one month. The March 25 price established the low for the year so far, as the price had trended slightly upward to US$29.18 per barrel by September 9, 2003. Clearly, most of the 40% increase in the first quarter of 2003 had been given back by the end of the third quarter, given that the end-of-period price of US$29.18 was 10.4% higher than the start-of-period price of US$26.42.
The Committee now moves further down the processing line to consider the wholesale prices of gasoline, using the Toronto rack price as the benchmark price for Canada. Beginning at 33.3¢ per litre on December 3, 2002, the Toronto rack price rose steadily to 47.7¢ on March 11, 2003 — a 43% increase in just three months — before dropping precipitously to 35.7¢ on March 25, 2003, a decrease of more than 12¢ per litre in just two weeks. Unlike the price of crude, this sudden drop in price was not over; further price declines were recorded. The year’s low so far was reached at 32.3¢ on June 24, 2003. The trend since then has been upward, finishing at 38.4¢ per litre on September 9, 2003. As with the price of crude, most of the 43% increase in the first quarter of 2003 had been given back by the end of the third quarter, given that the end-of-period price of 38.4¢ per litre stood 12.9% higher than the start-of-period price of 34¢.
The performance of the Toronto rack price of gasoline was very comparable to that of the Buffalo, NY, rack price. Excluding four anomalous dates (or weeks) in this period, the Toronto-Buffalo price spread never exceeded 2.5¢. On average, the Toronto rack price of gasoline was 0.8¢ higher than the Buffalo rack price, which was less than the cost of shipping the product cross-border and made further arbitrage by the market through trade unprofitable.
FIGURE 1
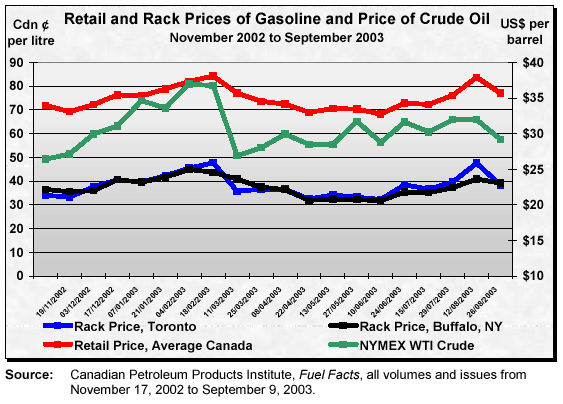
Finally, there is the retail price of gasoline. The Committee used the weighted-average price of regular gasoline as surveyed in 10 cities across the country.3 The retail price was 69.2¢ per litre on December 3, 2002, and it rose steadily to its peak of 84.2¢ by March 11, 2003 — a 21.7% increase in just three months. This price then trended down throughout the summer until reaching its bottom for the year so far at 68.2¢ on June 24, 2003, but it had rebounded to 77.1¢ by September 9, 2003. The end-of-period price remained 11.4% higher than at the start-of-period price.
When comparing the prices of crude, wholesale and retail gasoline products, the Committee notes that both rack and retail price increases and their pinnacles lagged crude price increases and its pinnacle by approximately one month. There was only a very short lag between retail and rack prices; rack price increases and decreases were completely factored into retail prices within a two-week period. In percentage terms, the rack price increased and decreased in roughly the same measure as the price of crude. The retail price of gasoline, however, increased by only half that of rack and crude prices in percentage terms, and its percentage decline in the year was also more tempered. The end-of-period crude, rack and retail prices were roughly 10% to 13% higher than their start-of-period prices.
Gas Pump Prices and their Components
The Committee now shifts its focus from the individual prices charged at each stage of processing to their combination. Stacking the prices at each stage of processing onto the prices of the previous stage indicates the price margins earned at each stage and provides a rough guide to who gets how much within the industry. With this objective in mind, the Committee used the four-week average crude, rack and retail prices of regular gasoline at key points in the past year, instead of the series of prices at any one time, to reduce the impact of any anomalies found at any processing stage. Anomalies in prices occur quite frequently in this industry due to volatile weekly pricing behaviour. Smoothing out price variances over a four-week period should provide more meaningful results and a better perspective on the operating margins of the different stages of production within the industry (see Figure 2).
FIGURE 2
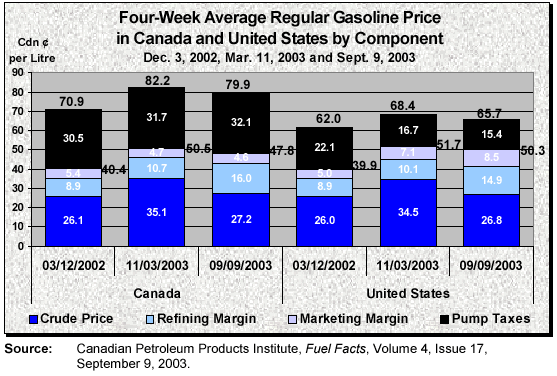
Obviously, crude oil prices that rose by 40% between late November 2002 and mid-March 2003 meant greater price margins for oil producers. By March 11, Canadian oil producers earned, on average, about 9¢ more per litre than they had in November 2002. This exceptional performance was short-lived, however, as crude prices returned to their pre-spike levels almost immediately. From late March to early September 2003, Canadian oil producers earned, on average, about 1¢ more per litre than they had in November 2002. American oil producers, on average, shared this experience.
Oil refineries improved their lot during this period as well, but on a different timeline from oil producers. While rack prices rose 43% between November 2002 and mid-March 2003, the average refinery price margin increased by less than 2¢ per litre, or about 20%, in this period.4 The significantly better operating performance of refineries was in fact recorded subsequent to March 2003. By September 2003, the average refinery price margin had increased to 16¢ per litre, up about 7¢, or 80%, from that recorded in November 2002. Again, American oil refineries had a similar experience.
Canadian gasoline retailers were not as fortunate as others in the industry. While retail gasoline prices rose by almost 22% between November 2002 and March 2003, the marketing price margin fell, on average, from 5.4¢ to 4.7¢ per litre in this period. By September 2003, the marketing price margin was squeezed another tenth of a cent to 4.6¢. This poor performance by Canadian gasoline retailers contrasts sharply with that of their U.S. counterparts. American gasoline retailers continuously increased their retail price margins from 5¢ in November 2002 to 7.1¢ and 8.5¢ in March and September 2003 respectively.
The final component of the retail price of gasoline is government taxes. In Canada, governments raised their tax take throughout this period. On average, taxes increased across the country from 30.5¢ per litre in November 2002 to 31.7¢ in March 2003 and again to 32.1¢ in September 2003. This performance contrasts sharply with developments in the United States. U.S. taxes on gasoline, which averaged 22.1¢ per litre in November 2003, decreased to 16.7¢ in March 2003 and again to 15.4¢ in September 2003. However, a caveat is warranted here. The Canadian dollar appreciated significantly against the U.S. dollar in this period and it is this development, not a reduction in U.S. federal and/or state taxes, which explains most, if not all, of the decline in the U.S. tax component of gasoline in Canadian dollar terms.
The relative performances of all parties in this period can now be evaluated. Consumers paid roughly 11.3¢ more per litre in March 2003 than in November 2002; of this increase 9¢ went to oil producers, 1.8¢ to refiners and 1.2¢ to governments, while retailers lost 0.7¢. By September 2003, consumers paid 9¢ more per litre than in November 2002, with retailers receiving 0.8¢ less, and refiners and governments receiving 7.1¢ and 1.6¢ more, respectively.
FIGURE 3
Component Shares of Regular Gasoline Price
September 9, 2003
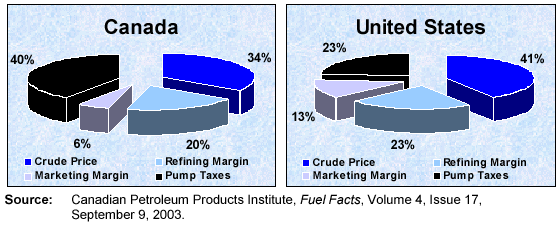
Finally, when evaluating the different component shares of retail gasoline revenues in Canada in percentage terms rather than on a per-litre basis, the Committee finds that the lion’s share is garnered by governments, whose taxes account for 40% of the average revenues earned for the four-week period ending September 9, 2003. Next are the oil producers with 34%, oil refineries with 20%, and retailers with 6% (see Figure 3). Comparing these shares to those in the United States, only Canadian governments do better; all other industry parties in Canada fare worse than their counterparts in the United States.
Gas Pump Prices and their Components Across Canada and at Selected Cross-border Locations
The Committee is also interested in the performance of the industry across the country. Accordingly, the Committee wants to be sure that the national averages observed above do not hide more important regional circumstances or differences.
Figure 4 provides the same information as the September 9 data in Figure 2, but broken down by five regions of Canada: Atlantic Canada, Quebec, Ontario, the Prairies and British Columbia. Figure 4 also includes the same price data at specific U.S. border locations that are believed to be good reference or benchmark places for comparison purposes. The Committee’s first observation is that, by and large, the provinces with the highest tax levels host the communities with the highest retail prices — Halifax and Kamloops being two exceptions (the latter likely because of the recent forest fire crisis). Conversely, the provinces with the lowest tax levels host the communities with the lowest retail prices of gasoline — Winnipeg and Charlottetown being two exceptions (the latter may be due to regulation).
FIGURE 4
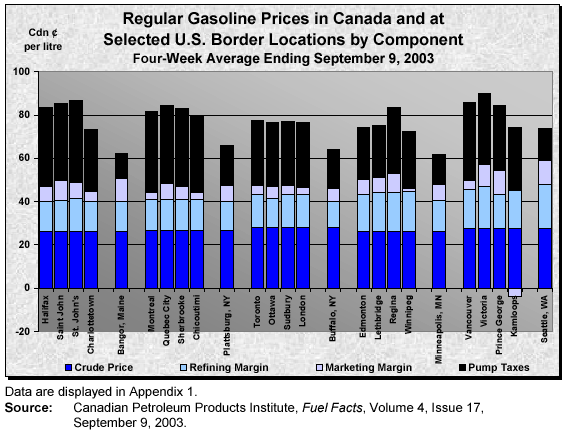
The Committee’s second observation is that differences in retail prices across the five regions of Canada can be explained mostly by regional tax differences, more precisely provincial taxes. Exceptions would be in Victoria and Prince George, where marketing margins were disproportionately large relative to elsewhere in Canada (but were comparable to that earned in Seattle, Washington).
The Committee’s final observation is that government taxes are higher everywhere in Canada than they are in the United States. Retail prices are, therefore, higher in every region of Canada than at respective reference or benchmark Canada–U.S. border locations, principally for this reason. Refining margins are also larger in every region of Canada than at respective reference Canada–U.S. border locations, except in British Columbia versus Seattle, Washington. Finally, marketing margins are smaller in every region of Canada than at respective reference Canada–U.S. border locations, except in Regina versus Minneapolis, Minnesota.
The Committee is left to conclude that the national averages found in the previous section are very representative of the results and observations found in the five regions of Canada. Regional differences exist but are not significant enough to alter the results obtained using national averages.
Gas Pump Prices Over the Longer Term and Across the G8 Countries
The Committee also looked into the performance of retail gasoline prices over the longer term and across the G8 countries to bring both a time perspective and an international perspective to the issue.
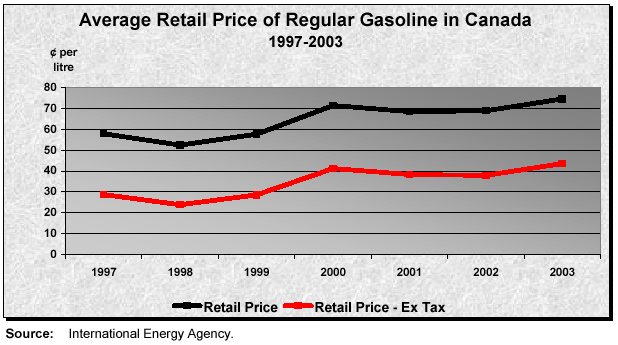
The average price of regular gasoline in Canada in 1986 — when the oil and gas industry was deregulated in Canada — was approximately 48¢ per litre including taxes and 30¢ excluding taxes. By 1997, the average price of gasoline including taxes stood at 58¢ and, excluding taxes, at 29¢ (see Figure 5). In 1999, prices began a steady climb to 75¢ per litre including taxes and 45¢ excluding taxes — the averages established so far in 2003. The tax component averaged 18¢ per litre in 1986 and grew to 29¢ by 1997 and to 31¢ by 2003. Over the longer term, then, the price of gasoline excluding taxes increased 50%, while taxes increased 67%. Taxes, therefore, are the fastest-growing component of the final price of gasoline.
FIGURE 5
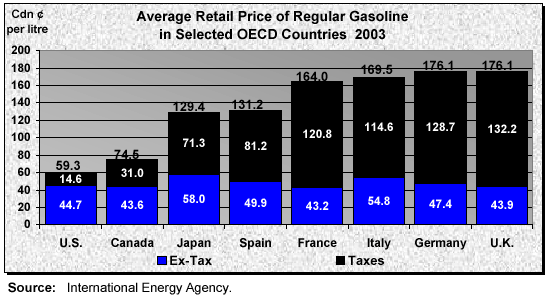
The price of gasoline across the G8 countries varies tremendously.5 In 2003 to date, the United States has the lowest average price of 59.3¢ per litre, followed by Canada at 74.5¢. The highest price was $1.76 in both Germany and the United Kingdom (see Figure 6). At 14.6¢ per litre, the United States imposed the lowest taxes on gasoline, followed by Canada at 31¢. The highest taxes were found in the United Kingdom at $1.32. Canada also placed second in terms of the lowest gasoline price excluding taxes at 43.6¢ per litre, just behind France at 43.2¢; Japan had the highest price of gasoline excluding taxes at 58¢.
FIGURE 6
| 1 | Unless otherwise indicated, all prices are in Canadian dollars. |
| 2 | This report relied heavily on data collected by MJ Ervin and Associates and published by the Canadian Petroleum Products Institute. Time constraints did not permit the Committee to seek independent sources of petroleum price data. |
| 3 | MJ Ervin and Associates data: Vancouver, Edmonton, Regina, Winnipeg, Toronto, Montreal, Saint John, Halifax, Charlottetown and St. John’s. |
| 4 | The Committee refers only to the industry’s price margins, not to its profit margins. A price margin is the difference between the price of the output and the price of the primary input at each stage of processing or distribution. A profit margin equals its price margin minus other per unit costs. |
| 5 | The ex-tax prices are not corrected for differences in product specifications, which can be significant across the G8 countries. |