INST Committee Report
If you have any questions or comments regarding the accessibility of this publication, please contact us at accessible@parl.gc.ca.
Industry Structure and Performance
The oil and gas industry is divided into “upstream” and “downstream” sectors. The main activities of the upstream sector are the exploration and development of crude oil, the raw material from which gasoline is distilled; but they also include drilling, production and transportation of the crude product to the refinery. The downstream sector can further be divided into two: the wholesale/refinery segment and the retail segment. Refineries process the crude oil for the manufacture of a variety of refined petroleum products, including gasoline, diesel, kerosene, heating fuels, jet fuels, lubricants, etc. The mix of these products is called the product slate, and gasoline accounts for approximately 40% of Canada’s slate. There is a clearly identifiable seasonal aspect to the demand for some of these products (e.g., heating fuel in the winter and gasoline in the summer). Retailers, for their part, sell gasoline (and other petroleum and confectionery products and motor vehicle services) to the motoring public, advertising their reference price for regular gasoline on large clearly visible street signs.
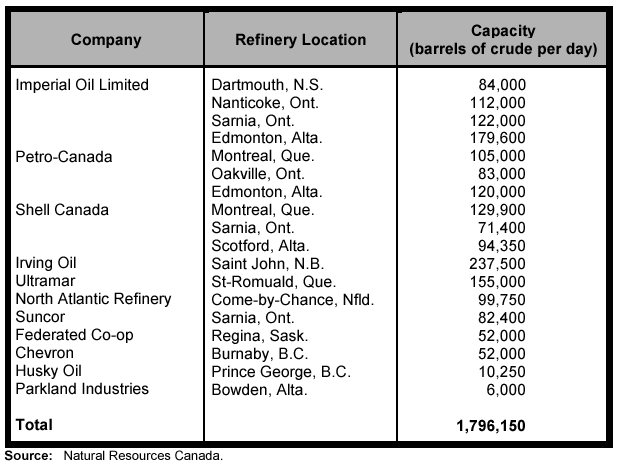
In terms of the refining segment of the downstream sector, North America boasts 65 refineries; these include 18 in Canada that are owned by 11 companies (see Table 1). Total Canadian crude refining capacity is 1,796,150 barrels per day,6 which is significantly less than it was throughout the 1980s and 1990s. Because of corporate innovation agendas that have focused on boosting productivity, this industry has witnessed the closure of many refineries across North America. For example, Canada boasted 40 refineries in the 1980s and 58 refineries in the 1970s.7 Industry productivity has risen sharply as production has become focused in fewer and more efficient plants. Capacity utilization rates have also risen with these closures. For example, capacity utilization rates have risen from about 65% in the early 1990s to 95% in 2002.8 Moreover, refiner margins, which were in excess of 10¢ a litre in the early 1990s, stabilized throughout the rest of the decade at about 7¢ a litre — a further indication of the success of the industry’s productivity agenda. There has been an upward trend in the refiner margin to 16¢ in Canada (and 14.9¢ in the United States) since the 1990s.
TABLE 1
Gasoline Refineries in Canada, 2003

At the same time, the Committee recognizes that the other side of the productivity coin is corporate concentration. Corporate concentration within the refining sector can be measured by the crude oil refining capacity of the largest four companies: Imperial Oil, Petro-Canada, Shell Canada and Irving Oil. These four firms account for 1,338,750 of 1,796,150 barrels of crude per day, or 74.5% of total Canadian refinery capacity. The high corporate concentration of oil refining capacity is most acute in Atlantic Canada and Ontario. When viewed regionally, the top three oil refiners in Atlantic Canada (Irving Oil, Imperial Oil and North Atlantic Refinery) account for 100% of regional capacity. In Ontario, the top three oil refiners (Imperial Oil, Petro-Canada and Shell Canada) account for 82.5% of provincial refinery capacity.
In terms of the retail segment of the downstream sector, there were 13,063 retail outlets in Canada in 2002. Corporate concentration in the retail segment is much lower than in the refining segment: Imperial Oil possesses 2,219 outlets; Petro-Canada, 1,534; and Shell Canada, 1,464. So the three largest vertically integrated producers, two of which are multinationals, account for about 40% of 13,063 retail gasoline outlets in Canada.
The greater fuel efficiency of motor vehicles and the productivity agenda of the retail segment of the downstream sector have also led to rationalization and innovation in this industry segment. In terms of rationalization, there has been a 40% reduction in the number of retail outlets since 1989, when there were more than 22,000 outlets. There has been a similar decline in the United States, where the number of retail outlets fell from 279,000 in 1972 to 155,000 in 2002, or by about 45%.9
The consequence of these two industry trends for gasoline throughput and marketing margins is significant. Between 1989 and 2002, the average Canadian retail gasoline service outlet improved its throughput of gasoline from 1.95 to 3.20 million litres per year, representing an increase of 64%. Current marketing margins are below those experienced in the 1980s, having stabilized in the late 1990s and early 2000s in the range of 4.6¢ to 6¢ per litre. This range remains above the break-even level of approximately 3¢ per litre for the three hypothetical but typical retail gasoline sites and operations as calculated by the Conference Board of Canada.10
Competition Among the Majors, the Regionals and the Independents
Gasoline retailing is characterized by a growing number of different types of suppliers. The Canadian marketplace, which once comprised just the vertically integrated suppliers (“majors”), regional marketers and one-station independents, is now composed of:
| • | Two vertically integrated multinationals: Esso and Shell Canada |
| • | One vertically integrated national: Petro-Canada |
| • | At least one vertically integrated regional in each region: Ultramar, Irving, Sunoco, Chevron, Husky, Federated Co-op |
| • | Mass merchants: Flying J, Safeway, Loblaws, Canadian Tire, Real Canadian Superstore, Save-on Foods, Costco, etc. |
| • | Many private branded distributors: Wilson’s Fuels, Pioneer, Domo, etc. |
| • | Thousands of one-station independent retailers. |
Evidence provided to the Committee shows that the majors were the first to begin (and more aggressive in) the move to withdraw retail sites from operation and rationalize their retail networks since 1990 (their outlets are down 36%). The regional vertically integrated companies (down 25%) and independents (down 10%) followed. Since 1998, the regional vertically integrated marketers and independents/mass merchants have in fact increased the number of their retail outlets. Market shares of gasoline sales by volume show a similar trend. Data collected by Kent Marketing indicate that independents/mass merchants’ market share of sales by volume declined from 23% in 1990 to a low of 21.7% in 1998 before rebounding to 23.5% in the third quarter of 2002. The regional marketers’ market share of 19.1% in 1990 had steadily improved to 21% in the third quarter of 2002. The majors’ market share of 57.2% in 1990 had declined to 55.4% in the third quarter of 2002.
As a final note, the Committee realizes that the market share performance of independents over the last decade reflects both the growing presence of new types of entrants (mass merchants, branded grocery chains and others) and the resilience and adaptability of traditional one-station independents. However, there is concern about the possibility that the vertically integrated companies may be able to cross-subsidize their different activities (between upstream and downstream sectors or between refining and retail segments of the downstream sector) to the detriment of independents. On this score, the Committee is aware of only one study that has empirically tested this possibility. According to the Conference Board of Canada, there is some indirect evidence of cross-subsidization between the two segments of the downstream sector, though it was statistically insignificant. The Conference Board of Canada also found indirect evidence of cross-subsidization between upstream and downstream sectors, but that the cross-subsidy flowing from the downstream sector to the upstream sector was miniscule — too miniscule to be predatory in intent.
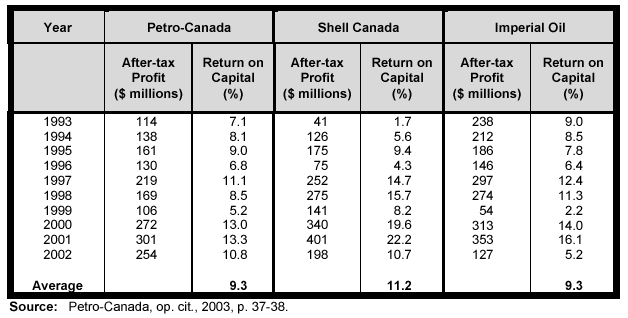
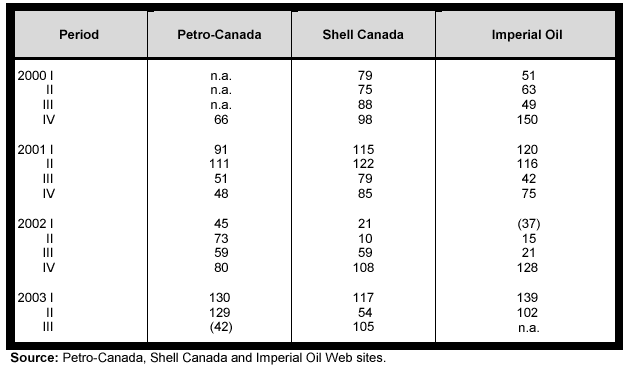
The Committee also examined the profitability of the downstream sector, focusing on the majors. Although after-tax profits are clearly cyclical, the downstream sector has been profitable throughout the past decade and especially in the past three years (see Table 2) — well before the positive impact the war in Iraq will provide (see Table 3). Put in price terms, downstream profits represent about 1.2¢ per litre of product sold, or about 2% of the pump price. Higher prices, increased productivity, gains in efficiency and diversification of retail activities have all contributed to the industry’s improved “bottom line.”
In terms of return on capital, the downstream sector has also fared well, with all three majors averaging between 9.3% and 11.2% over the past decade. However, some would argue that, after discounting for the risk taken, the returns on capital of the majors’ downstream sector are low when compared to the returns offered by other investment opportunities in the period.
TABLE 2
Petro-Canada, Shell Canada and Imperial Oil
Downstream Profitability and Return on Capital — 1993-2002

TABLE 3
Petro-Canada, Shell Canada and Imperial Oil Downstream Profitability
After-tax Profit: Quarterly, 2000 QI to 2003 QIII (in $ millions)

| 6 | Petro-Canada’s Oakville plant is scheduled to close. |
| 7 | Conference Board of Canada, The Final Fifteen Feet of Hose — The Canadian Gasoline Industry in the Year 2000, January 2001, p. 5. |
| 8 | Petro-Canada, Submission to the House of Commons Standing Committee on Industry, Science and Technology, March 10, 2003. |
| 9 | Conference Board of Canada, op. cit., 2001, p. 11. |
| 10 | Conference Board of Canada, op. cit., 2001, p. 15. |