FINA Committee Report
If you have any questions or comments regarding the accessibility of this publication, please contact us at accessible@parl.gc.ca.
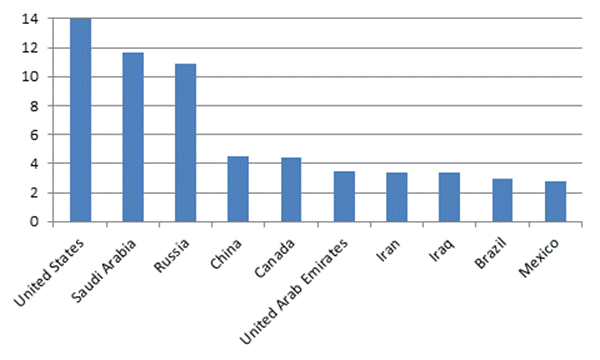
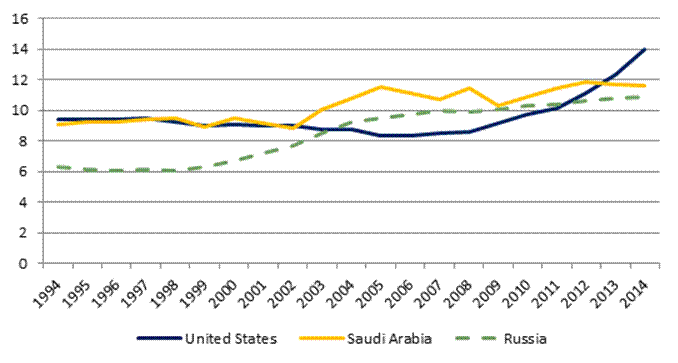
CHAPTER 2 – GLOBAL OIL PRODUCTION AND PRICESA. BackgroundThe term “oil production” is generally interpreted to include production of the following: crude oil, condensates and natural gas liquids; other hydrocarbons, such as synthetic crude oil and mineral oils; and petroleum products, such as refinery gas, ethane, liquefied petroleum gas, aviation gasoline, motor gasoline, jet fuels and kerosene. According to the International Energy Agency, global oil supply is forecasted to expand by 5.2 million barrels per day by 2020. Figure 1 shows the top 10 oil producing countries in the world in 2014; Canada ranked fifth in the world. According to Figure 2, in recent years, oil production in the United States has increased at a higher rate than in Saudi Arabia and Russia. Figure 1 – Top 10 Oil Producing Countries, 2014 (millions of barrels per day) Source: Figure prepared using information from: United States Energy Information Administration, Countries, Overview, Oil Production. Figure 2 – Oil Production, Selected Countries, 1994‒2014 (millions of barrels per day)
Source: Figure prepared using information from: United States Energy Information Administration, Countries, Overview, Oil Production. The price of a barrel of oil is based on its quality; quality characteristics include the ease with which the oil can be refined into gasoline, and the cost of delivery. The two most popular benchmarks for comparing the quality of oil extracted in a particular region are West Texas Intermediate (WTI) crude oil and Brent crude oil from the North Sea, while the benchmark for heavy crude oil in Canada is Western Canadian Select (WCS). Spot prices for WTI crude oil and Brent crude oil, or the price for immediate delivery of a barrel of oil, are the most widely quoted prices for oil. Spot prices for WTI crude oil and Brent crude oil are based on contracts traded at the New York Mercantile Exchange and the Intercontinental Exchange (ICE) respectively, while WCS spot prices are based on contracts traded at the Chicago Mercantile Exchange. After four years of relatively stable and high prices, the price for a barrel of Brent crude oil fell by roughly 60% from its June 2014 high of more than US$115 per barrel to less than US$46 in January 2015; the price of a barrel of WTI crude oil declined by 59% over that period. B. Witnesses’ Views1. PricesA number of the Committee’s witnesses commented on volatility in the price of oil. The Canadian Association of Petroleum Producers noted that volatility in commodity prices is the norm rather than the exception, and that the oil and gas sector has experienced periods of high and low prices in the last several decades. Suncor Energy Inc. indicated that short-term volatility in the price of a barrel of crude oil has been greater in recent months than has been the case in the last three or four years. Jean‑Thomas Bernard, who appeared as an individual, indicated that crude oil prices were unusually high over the 2010 to 2014 period, and were comparable to the prices that existed during the oil shock in 1979. While acknowledging its existence, the Alberta Federation of Labour felt that the volatility in the price of oil does not constitute a crisis or an emergency, and that the inflation-adjusted average price of a barrel of oil over the last 40 years has been $50. Packers Plus Energy Services highlighted that the price difference between a barrel of WTI crude oil and a barrel of Brent crude oil has been volatile since the differential was first observed in 2009. The Canadian Fuels Association explained that the difference between the price of crude oil and the retail price of gasoline reflects three components: the refiners’ margin; the retailers’ margin; and taxes. It also commented that the recent decline in the retail price of gasoline has not changed the margins of refiners and retailers; that said, there was a downward trend in the refiners’ margin over the past 2.5 years, while the retailers’ margins increased slightly over that period. While its view is that the retail price of gasoline reflects the change in the price of a barrel of crude oil, the Canadian Automobile Association‘s opinion is that the changing price of crude oil has not been proportionately reflected in Canadian retail gasoline prices. As well, the Canadian Fuels Association identified several influences on the retail price of gasoline in Canada, including: the futures market for crude oil; crude oil and gasoline inventories; seasonal weather effects on refineries; short-term maintenance of refineries; and U.S. exports of gasoline. In speaking about regional differences in the retail price of gasoline, the Canadian Association of Petroleum Producers commented that the price in Eastern Canada is based on the price of Brent crude oil, while that in Western Canada is based on WTI crude oil. 2. ProductionPacker Plus Energy Services spoke to the Committee about global oil production, noting that 94.5 million barrels per day are produced and 93.0 million barrels per day are consumed, resulting in an oversupply. Wade Locke, who appeared as an individual, pointed out that an oversupply of 1% to 2% in global oil production caused a 60% decline in the price of crude oil. The C.D. Howe Institute and RBC Financial Group stated that the recent decrease in the price of crude oil reflects excess global supply, although weaker global economic growth may also play a role. The C.D. Howe Institute also said that excess supply could be due to Russia and Iran having to produce more oil in order to maintain government revenues when the price of oil falls. In noting the importance of oil produced in the Organization of the Petroleum Exporting Countries (OPEC), Packer Plus Energy Services said that Canada has replaced Saudi Arabia as the top oil exporter to the United States. Andrew Leach, who appeared as an individual, indicated that Saudi Arabia’s global market power in relation to oil has been eroded by shale oil producers that are able to increase production quickly in response to high crude oil prices. RBC Financial Group suggested that Saudi Arabia’s recent decision not to reduce its oil production is a consequence of that country trying to reduce the market share of some of the higher-cost producers within and outside of OPEC. The Alberta Federation of Labour and the Canadian Association of Petroleum Producers highlighted that new production technologies in the natural gas sector resulted in a long-term decline in the price of natural gas, and suggested that similar technologies in the oil sector have led to a decrease in the price of oil. Regarding the global demand for energy, the Canadian Association of Petroleum Producers stated that world demand is increasing by 1% per year, or 1 million barrels per day on an annual basis; this increased demand is concentrated in Asia and Africa. In its submission to the Committee, the Canadian Association of Petroleum Producers indicated that, in 2014, its member companies produced 3.5 million barrels of oil per day. The Canadian Fuels Association stated that 2 million barrels of oil per day are refined in Canada; 1.6 million barrels are sold in Canada and the remaining barrels are exported, largely to the United States. It also noted that increased oil production and refining in North America reduced the profit margin on gasoline in January 2015. |

