INDU Committee Report
If you have any questions or comments regarding the accessibility of this publication, please contact us at accessible@parl.gc.ca.
There have been two dominant economic forces driving structural
change of the Canadian economy away from manufacturing and towards services,
one long term and, apparently, perennial, the other more recent and
indeterminate in duration. For more than five decades, the demand for services
by Canadians has been growing rapidly, both in absolute terms and relative to
that of goods. This force and its effect on the industrial structure of the
economy have largely gone undetected by the public, as the growth in demand for
services has been subtle but persistent. More recently, the worldwide
“commodities boom”, described in some detail above, is directly and indirectly
forcing a restructuring of the economy towards the natural resources and
services sectors and away from the manufacturing sector. Although the positive
impact on the natural resources sector from a “commodities boom” is rather
obvious, the positive impact on the services sector is not immediately
apparent. The demand for services by Canadians has been indirectly buoyed by
the “commodities boom” according to the following chain of events:
(1) the greater receipts earned by Canada’s natural resources sector, followed
by large investments — sometimes a takeover — in Canadian companies,
has led the Canadian dollar to appreciate in value (to balance the payments
between Canada and the rest of the world); (2) an appreciation of the Canadian
dollar has, in turn, made imported goods more competitive and has forced a
slowdown in overall retail price increases across Canada;
(3) retail price increases, which have been lower than personal income
increases for the better part of five years, have defacto augmented both
the purchasing power and the wealth of Canadians; and (4) Canadians, buoyed by
greater real personal incomes, have continued to purchase disproportionately
more services than goods. Like the longer-term trend towards more services,
this latter force and its effect on the structure of the economy, which is
entering its sixth consecutive year, has also gone undetected by the public,
largely because it has been overshadowed by layoff and shutdown announcements
in the manufacturing sector. Each of these trends will, in turn, be described
in more detail in the following sections.
Economic Contribution and Structural Change
Services consist of diverse activities that together, in 2007, accounted for almost 70% of GDP and more than 75% of employment in Canada. By way of comparison, the services sector contributes more than four and six times what the manufacturing sector contributes to GDP and employment, respectively, which amounted to 15.1% of GDP and 12.1% of employment in 2007.
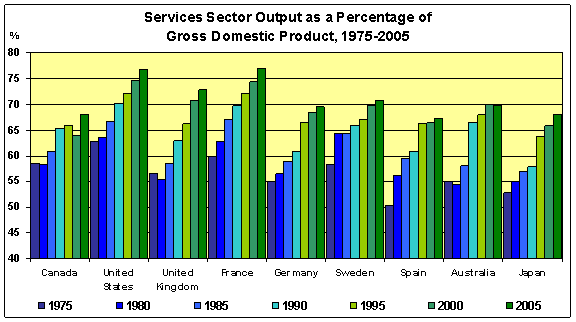
This large contribution made by the services sector to the Canadian economy was not always so. Services have been growing far more rapidly and consistently than the goods-producing sector throughout the past five decades. Thus, the shares of services in total economic activity and employment have been increasing steadily over time. For example, in 1975, services output accounted 58% of Canada’s GDP, and this share had grown to 68% by 2005 (see Figure 10). This development suggests that Canada’s economy has been undergoing profound, long-term structural change away from goods-producing activities and towards services — at least in percentage terms.3
Figure 10
ndicators, 2007.
Source: World Bank, World Development I
Canadians’ growing appetite or demand for services (in both absolute and relative terms) is not unique. Indeed, the long-term trend away from goods-producing and towards services-producing activities is found in many developed economies throughout the world. For example, as Canada’s services sector grew from 58% to 68% of GDP between 1975 and 2005, France led the way, growing its services sector from 60% to 77% of GDP. France was followed (in order of share of GDP in 2005) by the United States, the United Kingdom, Sweden, Australia, Germany and Japan. In 2005, all of these countries had a services sector that accounted for a greater share of GDP than did Canada. Of the eight comparator countries found in Figure 10, only Spain trailed Canada in terms of its services sector share of GDP.
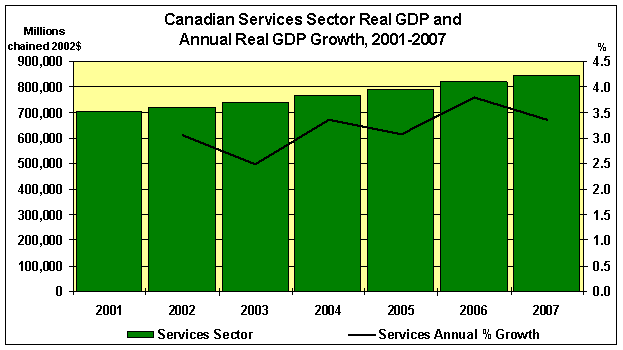
Against this long-term economic backdrop favouring services over goods, the current business cycle, spearheaded by a worldwide “commodities boom,” is indirectly reinforcing structural change in favour of services in Canada. Indeed, services sector real GDP has grown from $701.1 billion to $846.4 billion between 2001 and 2007, or approximately by 20.7% in the past six years (see Figure 11). Average annual growth of services sector GDP has therefore been 3.4%, which is about half a percentage point greater than the average annual growth rate of the Canadian economy in this period.
Figure 11
Source: Statistics Canada, Canadian Economic Observer, various dates.
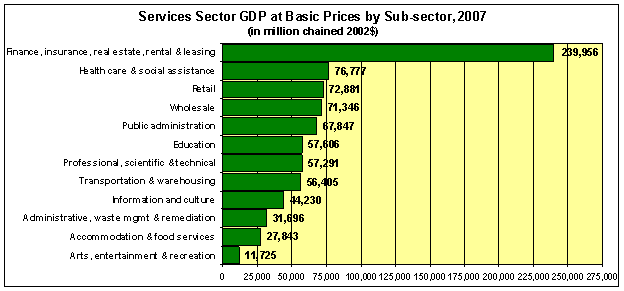
As mentioned above, the services sector incorporates many diverse activities, some of which are included in the business sector and some of which are not; Statistics Canada includes the latter services under the non-business sector. For example, industries with large proportion of public funding, such as health care and social assistance, public administration and education, are included in the non-business sector, and they make major contributions to GDP. Indeed, health care and social assistance, public administration and education have been growing relatively rapidly over the past several decades and, today, account for almost one-quarter of services sector GDP. Individually, these three public services sub-sectors are respectively the second, sixth and seventh largest services sub-sectors in Canada (see Figure 12).
Figure 12
Source: Statistics Canada, CANSIM Table 379-0017.
Growth of services within the business sector component has been fastest within wholesale trade, retail trade, and administrative support and waste management. Growth has been slowest in arts, entertainment and recreation, and accommodation and food services. In 2007, the five largest industries of the business services sector were: (1) real estate, rental, and leasing; (2) finance and insurance; (3) retail trade; (4) wholesale trade; and (5) professional, scientific and technical services.
As somewhat alluded to above, services provision can be organized
under a for-profit corporation, the principal organizational type used in the
business sector, or under a not-for-profit corporation, the principal
organizational type used in the non-business sector (using Statistics Canada’s
terminology, meant to combine the public or volunteer sectors of the economy).
An interesting but often overlooked organizational type is the co-operative
organization. Some co-operatives provide services rather than goods and, in the
process, they often straddle both business and non-business sectors. In Canada,
co-operatives can be found providing financial services through credit unions
and caisses populaires, insurance, retail goods, health care, childcare
and agricultural services.
More formally, a co-operative is a legal entity owned and democratically controlled equally by its members. Co-operatives are often organized as non-capital stock corporations under state-specific co-operative laws. They may, however, be organized as business corporations or unincorporated associations. Each co-operative has, as part of its mandate, the commitment to help its community (and also many co-operatives sustain the wider world community through their contributions to co-operative international development programs). Co-operatives do not generally pay dividends, but return savings or profits, sometimes known as patronage, to their members.
In 2007, there were more than 9,000 co-operatives in Canada that employed over 170,000 people and had assets totalling more than $260 billion. In addition, almost 100,000 individuals volunteer their time in helping manage the co-operatives by sitting on boards and committees. Co-operatives have some 18 million individual memberships, representing at least 13 million Canadians. This means that four in ten Canadians are members of a co-operative. The federated co-operatives have returned some $450 million in patronage dividends to local member retail co-operatives. In addition, credit unions gave back some $34.7 million in 2006 in the form of donations and contributions to community economic development; the Co-operators Group allocated $3.5 million in 2006 into community projects; and Mountain Equipment Co-op put 1% of its sales, or $2.4 million, into climate change projects in Canada.
In today’s globalized world, in which for-profit corporations are pursuing greater profits and maximizing shareholder value — sometimes leading to the flight of banks and retail stores from many inner cities and rural and remote communities — co-operatives have been increasingly noted for remaining in these communities, filling important gaps in services provision to its members.
Although services make up the greater share of domestic commercial activity and goods make up a much smaller share, the situation is entirely reversed when it comes to the international trade data. In 2007, Canada exported $67.5 billion and imported $86.9 billion in services, yielding a services trade deficit of $19.5 billion. Given that total Canadian exports and imports were $532.7 billion and $502.5 billion in 2007, respectively, services accounted for only 13% of exports and 17% of imports. Commercial services make up the bulk of Canadian services trade, and trade balances do not favour Canada in the most significant components of services trade.
It would be premature, however, to conclude that Canadian services make an insignificant contribution to Canada’s international trade account. With globalization marked by the forging of global supply chains, whereby corporations integrate trade, both imports and exports, within their worldwide production plant networks in a way that allows them to optimize the functioning of their global operations, trade in services is largely embedded in the trade of goods and capital investments. In effect, many services are not traded directly, but indirectly when they are integrated or embedded in the goods that are traded. For example, an American built or assembled airplane may rely on a component designed, produced and marketed in Canada. In this supply chain, Canada’s statistical agency records the export of the aerospace product, which is then aggregated in Canada’s merchandise goods account, yet the engineering and design services, as well as other managerial services, may make up the most significant cost component in this traded aerospace product. Moreover, continuing with this example, had the Canadian engineers provided only the blueprints of the aerospace product to the American airplane producer for it to manufacture in the United States, then Canada’s statistical agency would record the trade under Canada’s services account. Comparing these two alternative trading arrangements, the latter would record a much smaller amount of Canada-U.S. trade than the former, but the transaction would also be entirely recorded as a trade in services, whereas the former would be recorded as a trade in goods. The latter trading arrangement, thus, accurately records the amount of Canadian services exported, whereas the former understates the amount of Canadian services exported. Yet clearly more Canadian services are produced and ultimately exported to the United States under the former trading arrangement.
Globalization has seen enormous growth in traded goods and services. Although Canada exported only $67 billion in services in 2006, Export Development Canada estimates that Canadian companies with foreign operations sell about $140 billion worth of services each year.
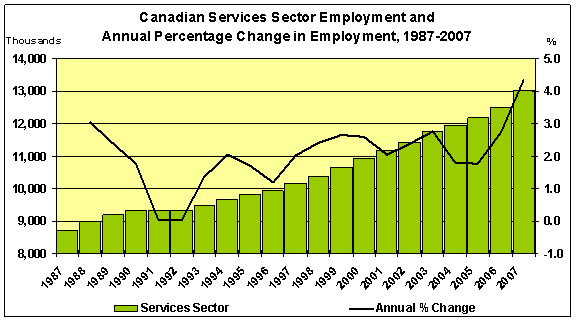
Employment in Canada’s services sector has also enjoyed long-term robust growth. Services sector employment approached 12.9 million in 2007, growing each year, on average, by 2% since 1987 (see Figure 13). This performance has picked up markedly since the “commodities boom” began, as the services sector grew on average by 2.4% per annum between 2002 and 2007. Indeed, the services sector accounted for almost 93% of the increase in employment in Canada between 2002 and 2007.
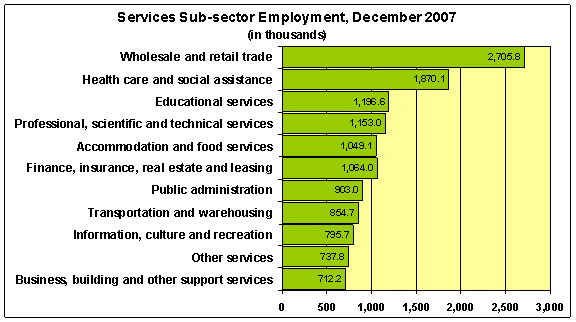
In the past five years, the largest increases in services sector employment have occurred in retail trade, health care and social assistance, and administrative support and waste management. In term of total employment in 2007, the top five services sub-sectors are: (1) retail trade; (2) health care and social assistance; (3) education; (4) accommodation and food services; and (5) public administration. One will observe that the order of these industries does not reflect the same order of the top five services sub-sectors in terms of contribution to GDP (compare Figures 12 and 14). Differential labour-intensities across the sector largely explain the re-ordered industry rankings.
Figure 13
Source: Statistics Canada, CANSIM Table 281-0024.
Figure 14
Source: Statistics Canada, Labour Force Survey, January 2008.
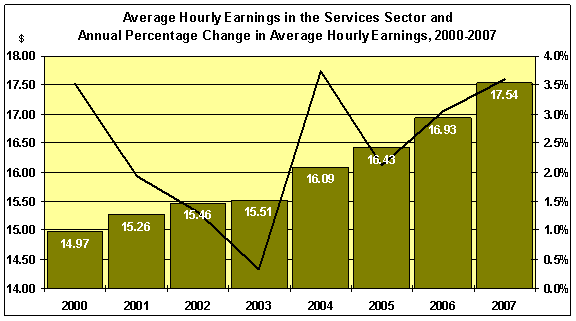
Canada’s relatively tight labour market has resulted in rising wages and benefits in the services sector. The average services sector wage has risen from $14.97 to $17.54 between 2000 and 2007, representing an average annual increase of 2.4% (see Figure 15). Hourly wages have also risen much faster since the “commodities boom” began; they have increased, on average, by 3.1% per annum in the past four years. Given that price inflation has averaged 2% and other sectors of the economy have experienced lower average wage increases in this period, Canadian services sector workers have made significant real and relative income gains since 2000.
Figure 15
Source: Statistics Canada, CANSIM Table 282-0087.
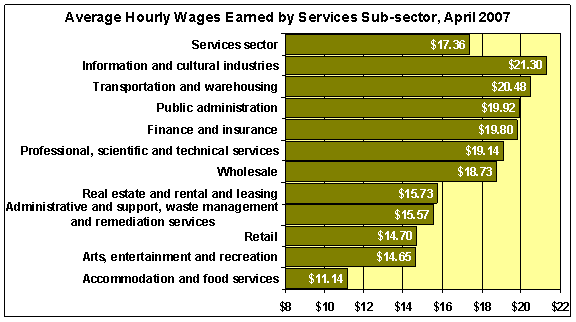
The diversity of activities comprising the services sector is also reflected in the wages paid by the various services sub-sectors. Wages range from an average of $11.14 per hour in the accommodation and food services industries, though this does not take into account the gratuities received by employees in these industries, to an average of $21.30 per hour in the information and cultural industries (see Figure 16). Sub-sectors paying wages greater than the average services sector wage include information and cultural industries, transportation and warehousing, public administration, finance and insurance, and professional, scientific and technical industries. Sub-sectors paying wages less than the average services sector wage include real estate and rental and leasing industries, administrative and support, retail trade, arts, entertainment and recreation, and accommodation and food services industries.
Figure 16
Source: Statistics Canada, CANSIM Table 282-0087.
Innovation often underlies the ability of Canada’s services sector to grow and compete internationally. Whether it is new processes resulting from intensive research and development (R&D), enhanced training or education, data storage, improved regulations or deregulation, or a new design and marketing strategy, innovations make the sector a better place to work, more efficient in providing services to Canadians, and more competitive.
Examples of innovation in the services sector include the move toward more internet banking; remote surgery; electronic health records; radio frequency identification (RFID) in retail stores, passports, the NEXUS system at the Canada-U.S. border, and for road tolls such as the 407 in the Toronto area. These and other innovations in the services sector are supported and, indeed, made possible by R&D across the sciences, social sciences and humanities. To be at the cutting edge of developing and implementing services sector innovations, Canada has had to invest in “blue sky”, basic and applied research, as well as import the results of foreign R&D.
Innovation can confer a competitive advantage on the providers of services, particularly those that are tradable internationally, but if this advantage is to endure, an intellectual property (IP) regime — that is, copyright, trademark and patents — that appropriately balances creator and user rights is essential. Accordingly, IP issues deeply concern and affect a broad range of service activities, such as technological breakthroughs in information and communications technology (ICT) services (e.g., the Blackberry); the distribution of television, Internet, books and other cultural products; and piracy and counterfeiting in the retail industry.
Figure 17
Source: Statistics Canada, CANSIM Table 358-0024.
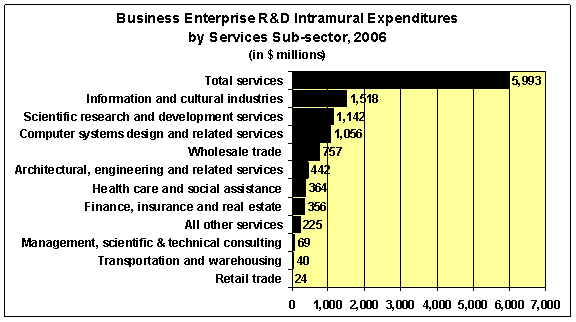
Canadian businesses within the services sector spent almost $6 billion on R&D in 2006 (see Figure 17). This intramural R&D spending included $1.5 billion by the information and cultural industries, $1 billion in computer system design, and $1.1 billion in scientific, research and development services. In addition, the information, communications technologies industry spent $5.7 billion on R&D in manufacturing and services.
[3] An important caveat is in order. The implied growth rate of the services sector using its percentage contribution to GDP over the past 30 years is, in part, a statistical artefact. With the large shift of the “baby boom” generation to two-income families from its predecessor generation that was predominantly composed of one-income families, whereby one parent withdrew from the paid labour force and engaged in domestic chores — that is, house cleaning, snow shovelling, lawn care, child care, child tutoring, meal preparation, etc. — which are not included in the calculation of GDP, these activities were increasingly contracted out to independent companies whose activities are included in the GDP calculation. Furthermore, previously illegal and strictly controlled activities, such as gambling, that mostly did not enter the GDP calculation are increasingly captured in the GDP calculation today. All of these activities are largely services and, thus, past services sector contributions to GDP were vastly understated statistically. Although the services sector’s contribution to GDP remains understated statistically — though less so today — the growth rate of the services sector’s contribution to GDP is likewise overstated.