INDU Committee Report
If you have any questions or comments regarding the accessibility of this publication, please contact us at accessible@parl.gc.ca.
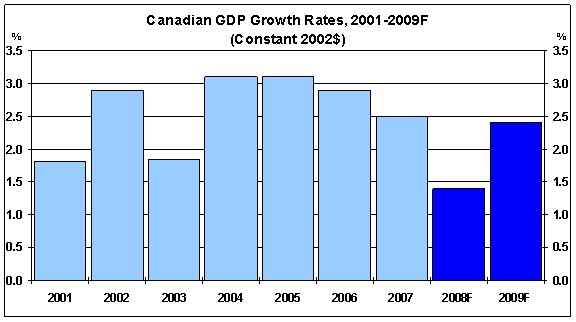
The Canadian economy has enjoyed robust growth over the past several years. Canadian real GDP — that is, Canada’s nominal gross domestic product (GDP) discounted to account for price inflation — grew in five of the past six years, averaging almost 3% per annum in this period (see Figure 1). There are a number of reasons behind this strong economic performance — not the least of which has been resilient domestic demand — but probably the most important and surprising factor has been rapid world economic expansion since 2003, particularly buoyant in China, India and Southeast Asia. According to Consensus Economics, world real economic growth has averaged about 3.5% per annum between 2003 and 2007, but in these above-mentioned Asian countries real economic growth has been more than double that of the world average. At the centre of this stellar performance has been the Asian demand for industrial commodities —markets for which Canada is well suited to serve and commodities in which Canada possesses a comparative advantage, particularly in terms of energy and base metal products.
Figure 1
Source: Bank of Canada, Monetary Policy Report Update, April 2008.
Figure 2
Source: Bank of Canada, http://www.bankofcanada.ca/en/rates/can_us_lookup.html.
Without a doubt “Emerging Economies” such as China and India are a significant source of demand for industrial commodities and considerably
higher Canadian commodity export prices, but they are also proving to be an
increasing source of competition in a number of industrial and consumer goods.
Indeed, substantially reduced prices for Canadian merchandise imports
originating increasingly from Asia, which have acted as a check on rising
domestic product prices, have been the most obvious and enduring economic
impact on Canadian markets of integrating these “emerging economies” in the
world trading system. As a result, Canada’s terms of trade — that is,
the ratio of Canadian export-to-import prices — has improved markedly
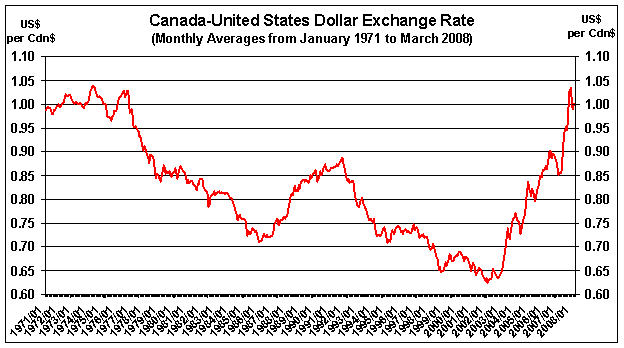
in this period,1 which has in turn led to a rapid and substantial appreciation of the Canadian
dollar against many currencies, most particularly the U.S. dollar. Furthermore,
Canada’s much improved terms of trade appears to have sparked international
investors’ interest in Canada. Net foreign direct investment (FDI) flows, which
had been mostly outbound rather than inbound to Canada in the last two decades
of the 20th century, turning Canada into a net FDI capital exporter
by 1997 for the first time since the country’s founding, reversed course.
Dominated by large foreign acquisitions of Canadian natural resource companies
beginning in 2006, Canada recorded
a net FDI inflow of $27.0 and $62.3 billion in 2006 and 2007, respectively.
This positive capital inflow undoubtedly reinforced and bolstered the
term-of-trade-inspired rise in the Canadian dollar over the past two years. All
told, the Canadian dollar has surged 78.5% in value relative to the U.S. dollar
in just six years — a surge that is without precedent since the
Government of Canada freed the Canadian dollar to float on the market in 1971
(see Figure 2).2
The Bank of Canada is further forecasting Canadian real GDP growth rates of 1.4% and 2.4% in 2008 and 2009, respectively. This forecast, made in April 2008, is predicated on U.S. real GDP growth rates of 1.0% and 1.7% in 2008 and 2009. Although these U.S. GDP annual growth rates are positive, the Bank of Canada does recognize that there is a good chance the recently slumping U.S. residential housing market, declining U.S. consumer confidence, and the large twin deficits of the U.S. federal government budget and the U.S. current account may conspire to drive the U.S. economy into recession in the first quarter or even the first half of 2008. These projections, therefore, point to an economic turnaround in the latter half or three-quarters of 2008, but they will nevertheless act as a further drag (over and above the high value of the Canadian dollar) on Canadian exports to the United States over the next two years.
The above predictions are, in general, shared by a number of forecasting outfits, but one would be remiss if one did not also recognize a diversity of opinions exists. For example, although acknowledging the possibility of a looming U.S. economic recession, the Conference Board of Canada is slightly more optimistic in forecasting U.S. real GDP growth rates of 1.6% and 2.5% in 2008 and 2009, thus leading to continued higher growth of Canadian real GDP of 2.2% and 3.0% in 2008 and 2009, respectively.
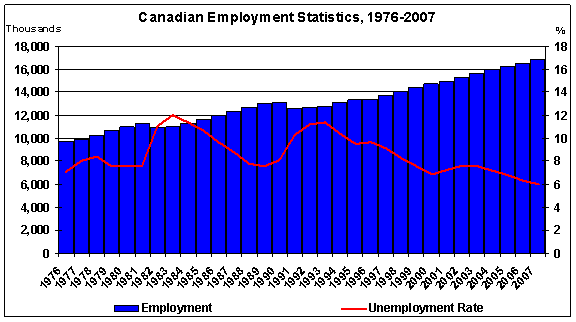
With Canadian real GDP growing rapidly and steadily as it has in the past several years, not surprisingly Canada’s labour market has also performed well in this period. Aggregate employment in Canada has grown from 15.6 million in January 2003 to 17.0 million in December 2007, thereby improving 1.4 million or 9% in just five years (see Figure 3). Job creation has been spectacular, averaging more than 280,000 per annum in this period. The employment rate has also increased steadily to 63.9% by March 2008, while the overall unemployment rate in Canada has hovered just below 6.0% for the past six months, even declining to 5.8% before returning to 6.0% in March 2008 — both of these statistics have respectively established a 33-year high/low in the process.
Figure 3
Source: Statistics Canada, Labour Force Survey, various dates.
Figure 4
Source: Statistics Canada, Labour Force Survey, various dates.
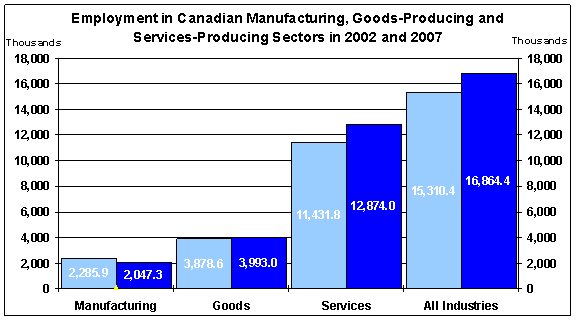
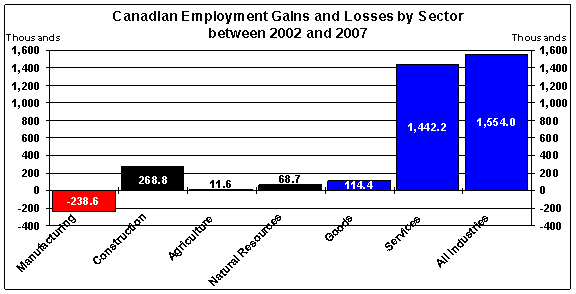
This employment growth has been widely felt throughout the economy, except in the manufacturing sector (see Figures 4 and 5). Services sector employment grew from 11.4 million in 2002 to 12.9 million in 2007 or by 14.1%. The goods-producing sector includes the manufacturing sector, as well as agriculture, natural resources, utilities and construction sectors. Employment in the manufacturing sector declined from its peak of 2.3 million in November 2002 to 2.0 million in March 2008, resulting in the loss of approximately 352,900 workers or 15.1% of its employed labour force in November 2002. However, agriculture, natural resources, utilities and construction sectors more than made up for the loss in employment in the manufacturing sector, as the goods-producing sector grew its employment from about 3.9 million in 2002 to about 4.0 million in 2007 or by 2.3%.
Figure 5
Source: Statistics Canada, Labour Force Survey, various dates.
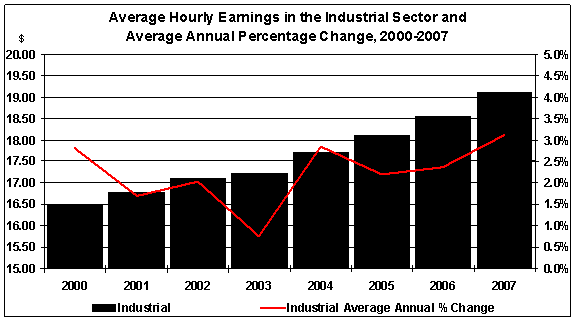
The relatively tight Canadian labour market (in historical terms) has also resulted in rapidly rising wages and benefits. The average industrial wage has risen from $16.49 to $19.13 between 2000 and 2007, representing an average annual increase of 2.1% (see Figure 6). Indeed, Canadian hourly wages have risen much faster since the “commodities boom” began; they have increased, on average, by 2.6% per annum in the past four years. Given that price inflation has averaged 2% in this period, Canadian workers have made significant real income gains since 2003.
Figure 6
Source: Statistics Canada, CANSIM Table 282-0087.
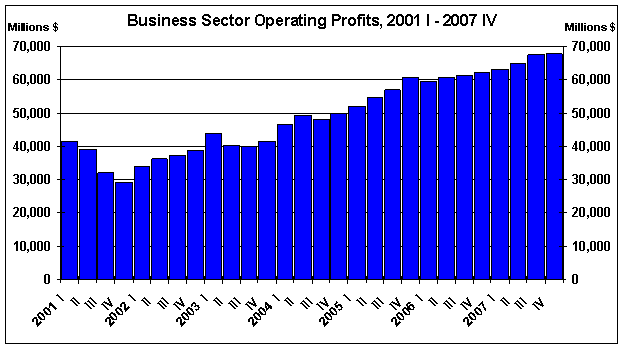
Business sector profitability has improved markedly over the 2000-2007 period. Operating profits in the business sector of $173.1 billion in 2000 declined for just one year before rebounding and growing in each successive year until reaching $262.5 billion in 2007, representing an increase of almost 52% in the past seven years (see Figure 7). Indeed, Canada’s business sector has repeatedly reported a new all-time high operating profit performance in each successive year since 2004. Almost in lock step, profit margins, return on equity, and return on capital employed in the business sector have also tracked higher in this period; they reached 8.8%, 12.1% and 8.7%, respectively, in 2007.
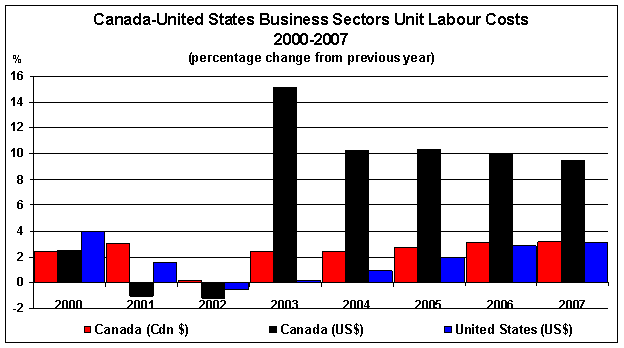
Unfortunately, Canada’s business sector has not performed well relative to the U.S. business sector in terms of productivity or competitiveness. Labour compensation per hour in the business sector has risen significantly more rapidly than labour productivity in Canada since 2000 — approximately 21% versus 7%, respectively — and, therefore, unit labour costs in Canada have risen by about 14% between 2000 and 2006 (see Figure 8). More importantly, after accounting for an appreciating Canadian dollar against the U.S. dollar, the Canadian business sector’s unit labour costs in U.S. dollar terms have risen by more than 50% between 2000 and 2006. The U.S. business sector, by comparison, has experienced only a 7% rise in its unit labour costs.
Figure 7
Source: Statistics Canada, Quarterly Financial Statistics for Enterprises, various dates.
Figure 8
Source: Statistics Canada, The Daily: Labour productivity, hourly compensation and unit labour cost, various dates.
In trying to isolate a cause for Canada’s relatively poor cost competitiveness with the United States, one immediately observes that hourly compensation has been quite comparable between the two countries, but hourly compensation in the United States has risen only slightly more than labour productivity in the United States. Thus, one difference in the performances between the business sectors of the two countries has been that of labour productivity, which in the United States rose by 17.5% compared to 6.4% in Canada between 2000 and 2006. However, Canada’s poor competitiveness against the United States since 2003 is, first and foremost, the result of a large and rapid appreciation of the Canadian dollar against the U.S. dollar. It can explain almost three-quarters of the 43 percentage point difference in unit labour costs. One caveat though: the rise in the Canadian dollar against the U.S. dollar is a business condition that is beyond the control of the business sector; only the business sector’s labour productivity performance is a business condition under the direct control of the sector.
Figure 9
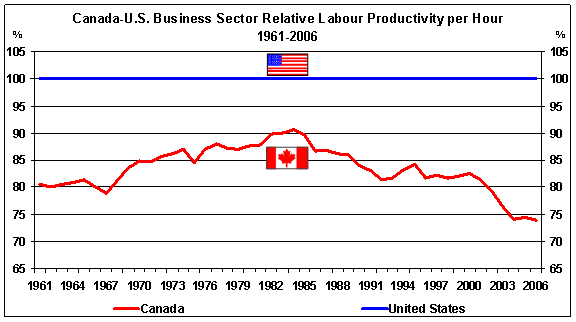
Source: Centre for the Study of Living Standards, http://www.csls.ca/data/iptjune2007.pdf, Table 7a.
Canada’s poor labour productivity performance relative to the United States is not a recent development; it is a continuing saga that began in the mid-1980s (see Figure 9). In 1984, Canadian business sector’s labour productivity relative to that of the United States reached its modern-day peak of 90.6%, but it has steadily declined to 74.0% in 2006.
[1] The most immediate cycle began in the fourth quarter of 2001 when it rose from its 2002-based index of 97.8 to 122.5 in the fourth quarter of 2007, representing a 25.3% increase in six years.
[2] The comparison is made between the base case (denominator) of 61.79¢ US on January 21, 2002 and its peak of US$1.1030 on November 7, 2007.