CHPC Committee Report
If you have any questions or comments regarding the accessibility of this publication, please contact us at accessible@parl.gc.ca.
CHAPTER 2: SELECTED STATISTICAL DATA
This committee’s June 2005 Interim Report presented available statistics of greatest relevance to its study of the feature film policy. Since that time additional data on the recent and current state of Canada’s film industry have been collected and reviewed. The following chapter presents selected data that both supplement and enhance the statistics provided in the Interim Report.
Part A presents longitudinal data that show the extent to which Canada’s feature film industry contributes to the cultural and economic sectors. Part B presents data provided by the Department of Canadian Heritage and the Canadian Audio-Visual Certification Office (CAVCO) that help identify areas where progress has (or has not) been made in meeting the objectives of the 2000 feature film policy. Part C reviews recent data collected by Decima Research and the Canadian Internet Project concerning Canadians’ movie viewing and Internet usage habits.
A. ECONOMIC CHARACTERISTICS OF THE FILM INDUSTRY IN CANADA
Any examination of the economic aspects of the Canadian film industry faces two notable limitations. First, the most current data available from Statistics Canada are for the period 1996-2001; second, Statistics Canada data do not distinguish between distinctly Canadian productions and foreign-location service productions shot in Canada. That said, there are a number of general trends and patterns worth noting.
Locating the Film Industry within the Cultural Sector
Figure 2.1 shows that from 1996 to 2001, GDP generated from the cultural sector as a whole amounted to an average of over $33 billion per year. During this same period, this contribution averaged approximately 3.8% of the total Canadian GDP.
|
Figure 2.1 |
Canadian cultural sector GDP in current dollars ($ millions), 1996 to 2001 |
|||||||||
|
|
1996 |
1997 |
1998 |
1999 |
2000 |
2001 |
Average 1996 to 2001 |
|||
|
GDP |
% change |
Annual growth rate |
||||||||
|
Canadian GDP |
774,404 |
816,763 |
840,473 |
903,750 |
995,219 |
1,022,055 |
892,111 |
32.0% |
5.7% |
|
|
Cultural sector GDP |
29,233 |
30,441 |
32,375 |
33,953 |
37,489 |
38,486 |
33,663 |
31.7% |
5.7% |
|
|
Cultural sector GDP as a % of Cdn. GDP |
3.77% |
3.73% |
3.85% |
3.76% |
3.77% |
3.77% |
3.77% |
- |
- |
|
|
Source: Statistics Canada, Economic Contribution of Culture in Canada, 2004 |
||||||||||
Figure 2.2 shows that between 1996 and 2001 the Canadian film industry generated an annual average of $2.7 billion in GDP, making it the third largest cultural sub-sector in terms of its overall contribution to GDP.
|
Figure 2.2 |
Canadian cultural sector GDP by sub-sectors ($ millions), 1996 to 2001 |
||||||||
|
|
1996 |
1997 |
1998 |
1999 |
2000 |
2001 |
1996 to 2001 |
||
|
Average |
% share |
||||||||
|
Written media |
11,787 |
12,619 |
13,328 |
13,843 |
15,576 |
16,745 |
13,983 |
43 |
|
|
Broadcasting |
3,347 |
3,781 |
3,782 |
3,857 |
4,237 |
4,468 |
3,912 |
12 |
|
|
Film Industry |
2,113 |
2,124 |
2,565 |
2,876 |
3,069 |
3,212 |
2,660 |
8 |
|
|
Advertising |
1,731 |
1,840 |
1,851 |
2,235 |
2,532 |
2,493 |
2,114 |
7 |
|
|
Performing Arts |
1,460 |
1,368 |
1,563 |
1,582 |
1,303 |
1,373 |
1,442 |
4 |
|
|
Visual Arts |
1,239 |
1,105 |
1,174 |
1,286 |
1,209 |
1,020 |
1,172 |
4 |
|
|
Libraries |
1,156 |
1,146 |
1,137 |
1,128 |
1,120 |
1,113 |
1,133 |
4 |
|
|
Design |
844 |
899 |
916 |
946 |
1,020 |
1,039 |
944 |
3 |
|
|
Sound recording and music |
931 |
1,043 |
1,124 |
776 |
852 |
807 |
922 |
3 |
|
|
Heritage |
812 |
829 |
877 |
921 |
970 |
1,010 |
903 |
3 |
|
|
Architecture |
627 |
553 |
742 |
764 |
1,024 |
916 |
771 |
2 |
|
|
Photography |
322 |
232 |
234 |
359 |
375 |
343 |
311 |
1 |
|
|
Festivals |
34 |
34 |
45 |
50 |
57 |
65 |
47 |
0.1 |
|
|
Source: Statistics Canada, Economic Contribution of Culture in Canada, 2004. |
|||||||||
GDP generated by the industry also rose steadily between 1996 and 2001. As Figure 2.3 demonstrates, the film industry enjoyed the second fastest growth rate of all cultural sub-sectors.
|
Figure 2.3 |
GDP growth rates in cultural sub-sectors, 1996 to 2001 |
||||||
|
|
% Change |
Average annual % growth rate |
|||||
|
1996 to 1997 |
1997 to 1998 |
1998 to 1999 |
1999 to 2000 |
2000 to 2001 |
|||
|
Festivals |
-1.2 |
33.7 |
11.3 |
13.7 |
13.7 |
14.2 |
|
|
Film Industry |
0.5 |
20.7 |
12.1 |
6.7 |
4.6 |
9.0 |
|
|
Architecture |
-11.7 |
34.1 |
2.9 |
34.0 |
-10.5 |
9.8 |
|
|
Advertising |
6.3 |
0.6 |
20.7 |
13.3 |
-1.6 |
7.0 |
|
|
Written media |
7.1 |
5.6 |
3.9 |
12.5 |
7.5 |
7.3 |
|
|
Broadcasting |
13.0 |
0.02 |
2.0 |
9.8 |
5.5 |
6.1 |
|
|
Heritage |
2.1 |
5.9 |
5.0 |
5.3 |
4.2 |
4.5 |
|
|
Design |
6.5 |
1.9 |
3.2 |
7.8 |
1.9 |
4.3 |
|
|
Photography |
-27.9 |
0.9 |
53.2 |
4.5 |
-8.6 |
4.4 |
|
|
Libraries |
-0.8 |
-0.8 |
-0.8 |
-0.7 |
-0.7 |
-0.8 |
|
|
Performing Arts |
-6.3 |
14.2 |
1.2 |
-17.6 |
5.4 |
-0.6 |
|
|
Sound recording and music |
12.0 |
7.8 |
-31.0 |
9.9 |
-5.3 |
-1.3 |
|
|
Visual Arts |
-10.8 |
6.2 |
9.6 |
-6.02 |
-15.6 |
3.3 |
|
|
Source: Statistics Canada, Economic Contribution of Culture in Canada, 2004. |
|||||||
Figure 2.4 reveals that Canada’s cultural sector employed more than half a million Canadians in any given year between 1996 and 2001. During this same period, the film industry employed an average of 67,500 Canadians, less than half the amount employed in written media, but still the second largest cultural sub-sector in terms of overall employment.
|
Figure 2.4 |
Employment in the Canadian cultural sector by sub-sectors, 1996 to 2001 |
||||||||
|
|
1996 |
1997 |
1998 |
1999 |
2000 |
2001 |
Average |
% share of culture |
|
|
Written media |
156,000 |
160,000 |
150,600 |
151,200 |
168,000 |
165,500 |
158,600 |
31 |
|
|
Film Industry |
44,000 |
49,800 |
63,800 |
78,800 |
84,000 |
91,800 |
67,500 |
13 |
|
|
Broadcasting |
45,900 |
42,400 |
47,000 |
45,500 |
51,500 |
56,600 |
48,200 |
10 |
|
|
Design |
44,700 |
42,000 |
42,400 |
42,500 |
45,900 |
44,600 |
43,700 |
9 |
|
|
Advertising |
36,400 |
36,400 |
39,900 |
42,000 |
47,100 |
49,000 |
41,800 |
8 |
|
|
Heritage |
31,900 |
32,000 |
33,300 |
34,800 |
35,100 |
35,600 |
33,800 |
7 |
|
|
Libraries |
24,700 |
24,700 |
24,700 |
24,700 |
24,700 |
24,600 |
24,700 |
5 |
|
|
Performing art |
24,000 |
21,600 |
22,200 |
20,900 |
21,000 |
21,100 |
21,800 |
4 |
|
|
Sound recording and music |
16,100 |
18,000 |
21,200 |
17,400 |
15,200 |
17,200 |
17,500 |
3 |
|
|
Visual arts |
13,300 |
12,000 |
14,700 |
15,900 |
14,300 |
13,200 |
13,900 |
3 |
|
|
Architecture |
10,000 |
9,700 |
12,200 |
14,400 |
18,200 |
15,700 |
13,400 |
3 |
|
|
Photography |
11,600 |
8,000 |
7,500 |
10,000 |
9,100 |
8,600 |
9,100 |
4 |
|
|
Festivals |
2,300 |
2,300 |
2,900 |
3,200 |
3,600 |
4,000 |
3,000 |
1 |
|
|
Source: Statistics Canada, Economic Contribution of Culture in Canada, 2004 |
|||||||||
As for overall progress during this period, Figure 2.5 shows that the film industry was the fastest growing employer in the cultural sub-sector, with average annual growth rates of 9%.
|
Figure 2.5 |
Employment growth rates in the Canadian cultural sector by sub-sectors, 1996 to 2001 |
|||||||
|
|
% change |
Average annual % growth rate |
||||||
|
1996 |
1997 |
1998 |
1999 |
2000 |
1996 |
|||
|
Film Industry Festivals Architecture Advertising Broadcasting Sound recording and music Heritage Written media Design Libraries Visual arts Performing arts Photography |
13.2 0.0 -3.0 0.0 -7.6 11.8 0.3 2.6 -6.0 0.0 -9.8 -10.0 -31.0 |
28.1 26.1 25.8 9.6 10.8 17.2 4.1 -5.9 1.0 0.0 22.5 2.8 -6.3 |
23.5 10.3 18.0 5.3 -3.2 -17.5 4.5 0.4 0.2 0.0 8.2 -5.9 33.3 |
6.6 12.5 26.4 12.1 13.2 -12.6 0.9 11.1 8.0 0.0 -10.1 0.5 -9.0 |
9.3 11.1 -13.7 4.0 9.9 13.2 1.4 -1.5 -2.8 -0.4 -7.7 0.5 -5.5 |
108.6 73.9 57.0 34.6 23.3 6.8 11.6 6.1 -0.2 -0.4 -0.8 -12.1 -25.9 |
9.0 5.8 6.5 2.7 1.4 2.3 1.0 0.4 -0.3 0.0 1.4 -1.5 17.3 |
|
|
Source: Statistics Canada, Economic Contribution of Culture in Canada, 2004. |
||||||||
GDP and Employment within the Film Industry by Activity
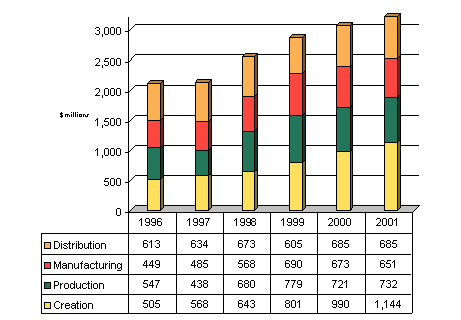
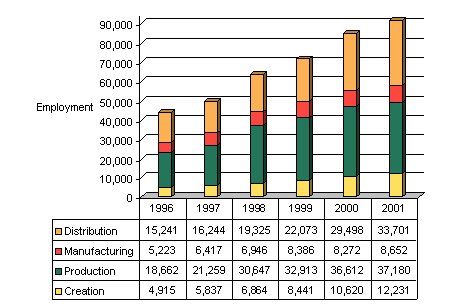
Figure 2.6 shows that with respect to GDP generated, the most economically significant elements of the Canadian film industry’s cultural process are the creation and production stages. Film industry GDP, however, grew steadily in all areas of the creative process during the period in question. As can be seen in Figure 2.7, film industry employment, production and distribution generated two-thirds of all jobs. Moreover, between the years 1996 to 2001, the number of people employed in every stage, except manufacturing, doubled.
|
Figure 2.6 |
Canadian film industry GDP ($ millions), 1996 to 2001 |
|
|
|
Totals: |
|
|
Source: Statistics Canada, Economic Contribution of Culture in Canada, 2004 |
|
|
|
Figure 2.7 |
Canadian film Industry employment, 1996 to 2001 |
|
|
|
Totals: |
|
|
Source: Statistics Canada, Economic Contribution of Culture in Canada, 2004 |
|
|
|
Summary of Findings Between 1996 and 2001, the Canadian film industry: • was Canada’s third largest cultural sector, generating an annual average of $2.7 billion in GDP; • employed an annual average of 67,500 people annually; • was the fastest growing cultural sub-sector in terms of employment. |
B. CANADIAN FEATURE FILM: SELECTED DATA
The Committee’s Interim Report presented a useful range of selected data on the state of the Canadian feature film industry. These data showed that:
| • | the overall audience share for Canadian feature films is closing in on the policy target of 5%; |
| • | Canadian films in the French-language market now enjoy a market share of more than 25%; |
| • | Canadian films in the English-language market continue to struggle, but audiences have increased very slightly, from a market share of 0.2% in 2001 to 1.6% in 2004; |
| • | production budgets have been on the rise and an increasing number are in fact above the $5 million threshold proposed by the policy; |
| • | box office revenues, although down overall in 2004, continue to climb for Canadian films; and |
| • | public support for Canadian film production is more important than ever before. |
In September 2005, the Department of Canadian Heritage released a Summative Evaluation of the Canadian Feature Film Policy. This section provides selected data from that report as well as from CAVCO, which help shed further light on areas where progress has and has not been made in meeting the objectives of the 2000 feature film policy.
Direct Federal Support to Feature Film
As seen in Figure 2.8, the total financial resources committed to the Canadian Feature Film Policy for 2004-2005 amounted to almost $100 million, a significant increase from the $65 million commitment in the year prior to the release of the Policy.
|
Figure 2.8 |
Canadian Feature Film Policy resources, including administration costs ($ millions), 1999-00 to 2004-05 |
|||||||
|
1999 |
2000 |
2001 |
2002 |
2003 |
2004 |
||
|
Creative and Professional Development · Film and Video Production Cooperatives(Canada Council for the Arts) · Non-Theatrical Production (Canadian Independent Film and Video fund) · Low Budget Independent Feature Film Assistance Program (Telefilm) |
1.9 - - |
2.9 1.8 1.8 |
2.9 1,8 1.8 |
2.7 1.8 1.8 |
3.6 1.55 1.8 |
2.7 1.55 1.8 |
||
|
Canada Feature Film Fund (Telefilm Canada) · Screenwriting Assistance Program - · Project Development, Production and Marketing Assistance Program · Complementary Activities Program |
- |
0.45 |
2.3 |
2.3 |
1.5 |
1.17 |
||
|
Feature Film Preservation and Access · Library and Archives Canada · AV Preservation Trust |
- |
0.6 |
0.6 |
0.6 |
0.55 |
0.55 |
||
|
Total Resources · Total Resources (Including Administration) · Policy Monitoring & PCH Administration · Total Policy Resources |
50 |
64.5 |
99.5 |
99.5 |
98.25 |
99.25 |
||
|
Source: Department of Canadian Heritage, Summative Evaluation of the Canadian Feature Film Policy, September 2005 |
||||||||
This table shows that the vast majority of Canadian Feature Film Policy resources are allocated to Telefilm Canada, almost $94 million for 2004-2005. This makes Telefilm’s Project Development, Production and Marketing Assistance Program, which received almost $84 million in 2004-2005, the policy’s most significant program.
Federal (and provincial) tax credits represent an important indirect support element for feature film productions made in Canada. During the period the Committee was working on its Interim Report, disaggregated data on the total number of feature films that receive the Canadian Film or Video Producion Tax Credit (CPTC) and the Film or Video Production Services Tax Credit (PSTC) support were not available. Since that time CAVCO has supplied these data to the Committee.
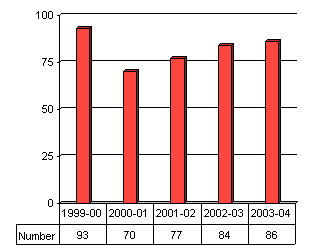
Figure 2.9 shows the number of theatrical productions certified as “Canadian” by CAVCO for the purposes of benefiting from the CPTC from 1999 through 2004. This figure shows that the total number of certified productions increased steadily, from 70 in 2000-2001 to 86 in 2003-2004.
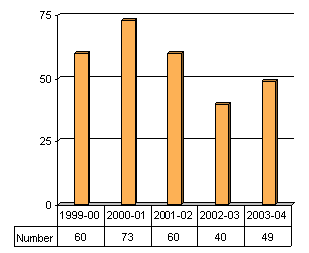
Figure 2.10 shows the total number of productions from 1999 to 2004 that were not certified as “Canadian” for the purposes of the CPTC but were approved by CAVCO to use the PSTC. As can be seen, the number of these productions fluctuated notably, from a high of 73 in 2000-2001 to a low of 40 in 2002-2003.
|
Figure 2.9 |
Total number of CPTC certified film productions, 1999-00 to 2003-04 |
Figure 2.10 |
Total number of PSTC accredited film productions, 1999-00 to 2003-04 |
|
|
|
||
|
Source: CAVCO data (as reported by the Canada Revenue Agency) |
|||
Scriptwriting Resources by Language
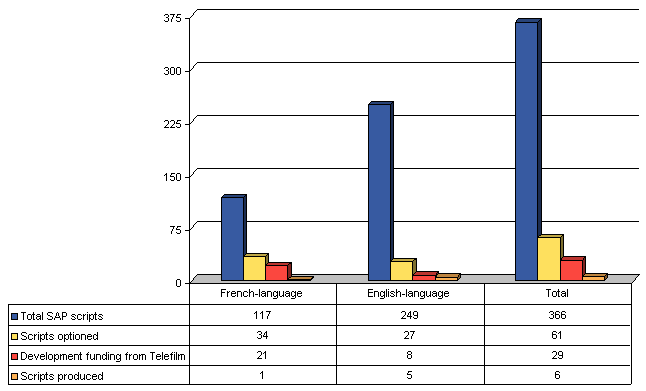
An important objective of the Canadian Feature Film Policy is to develop and retain talented creators. Figure 2.11 shows the progression of French- and English-language movie scripts through Telefilm’s Screenwriters Assistance Program (SAP). It can be seen that French-language scripts were almost three times more likely than English-language scripts to be optioned, and five times more likely to make it to the development stage. The relative success rate of French-language and English-language SAP scripts is more difficult to evaluate, however, because, as of January 2005, a number of French-language SAP scripts were still being considered for production funding.
|
Figure 2.11 |
From Script to Screen: Overall progression of Screenwriters Assistance Program (SAP) scripts, as of January 2005 |
|
|
|
Figure 2.12 shows that average marketing budgets for films awarded financial support from Telefilm have increased steadily since the introduction of the policy in 2000. Until 2003-2004 the average marketing budget for French-language films was the same as, or higher, than the average marketing budget for English-language films. Given that the Quebec market is smaller and more concentrated than the rest of Canada, this suggests that French-language films are being more intensely marketed to prospective audiences than English-language films.
|
Figure 2.12 |
Average marketing budgets of feature films receiving Telefilm financial support, 1998-99 to 2003-04 ($ thousands) |
|
|
|
|
Source: Department of Canadian Heritage, Summative Evaluation of the Canadian Feature Film Policy, September 2005 |
|
Regional Distribution of Production Funding
Fostering the quality and diversity of Canadian films is also among the goals identified by the Canadian Feature Film Policy is. Figure 2.13 shows the regional distribution of films that received funding as well as total financial commitments made for production from the Canada Feature Film Fund and the Low Budget Independent Feature Film Fund.
|
Figure 2.13 |
Regional distribution of Telefilm support for feature film Production (CFFF and IFAP), All projects, 2001-2004 (%) |
||||
|
|
|||||
|
|
Total Projects |
Total Financial Commitments |
|||
|
Projects |
% of Total |
$ millions |
% of Total |
||
|
Provinces Quebec |
79 |
49 |
85.9 |
47 |
|
|
Ontario |
37 |
23 |
45.4 |
25 |
|
|
British Columbia |
17 |
11 |
12.5 |
7 |
|
|
Alberta |
4 |
2 |
5.4 |
3 |
|
|
Nova Scotia |
3 |
2 |
3.4 |
2 |
|
|
Manitoba |
2 |
1 |
1.7 |
1 |
|
|
Newfoundland |
2 |
1 |
0.5 |
<1 |
|
|
Saskatchewan |
1 |
1 |
0.2 |
<1 |
|
|
Provinces: Subtotal |
145 |
90 |
155 |
86 |
|
|
Provincial co-productions |
|
|
|
|
|
|
Ontario/Nova Scotia |
5 |
3 |
5.5 |
3 |
|
|
Ontario/British Columbia |
3 |
2 |
5.7 |
3 |
|
|
Ontario/Quebec |
2 |
1 |
2.4 |
1 |
|
|
Alberta/Quebec |
2 |
1 |
4.4 |
2 |
|
|
Saskatchewan/Ontario |
2 |
1 |
4.0 |
2 |
|
|
Ontario/Alberta |
1 |
1 |
2.0 |
1 |
|
|
Ontario/Manitoba |
1 |
1 |
2.2 |
1 |
|
|
Provincial co-productions: Subtotal |
16 |
10 |
26.2 |
13 |
|
|
Total |
161 |
100 |
181.2 |
100 |
|
|
Source: Department of Canadian Heritage, Summative Evaluation of the Canadian Feature Film Policy, Sept. 2005 |
|||||
This table reveals that film producers in Quebec benefit far more than their counterparts in other provinces from production funding support. Indeed, 49% of all films awarded funding between 2001 and 2004 went to films made by Quebec-based production houses.3 In addition, 47% of the total financial commitments made under the Canada Feature Film Fund and the Low Budget Independent Feature Film Fund went to films from Quebec. Films from Ontario and British Columbia were secondary and tertiary beneficiaries at 23% and 11% of total films supported, respectively. Excluding provincial co-productions, about 4% of films supported came from the Prairie region and just 3% from the Atlantic.
Domestic Box Office Shares by Production Type
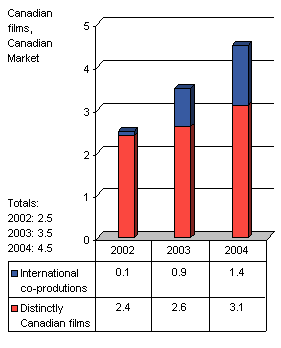
The Canadian Feature Film Policy has the crucial objective of building audiences at home and abroad for Canadian feature films. The Interim Report presented a series of box-office and market share data. Overall, it was seen that the viewing of Canadian films in theatrical release has been on the rise, from 2.3% in 2000 to 4.6% in 2004. It was noted, however, that most of the growth in the Canadian market share could be explained by a rise in the viewing of Canadian films in the French market, where the market share more than doubled from 12.3% to 26.9%. The viewing of Canadian films in the English-language market during this same period, however, experienced virtually no growth, rising from 0.2% in 2001 to 1.6% in 2004.
Figure 2.14 further disaggregates these linguistic market share data. This figure shows that increases in audiences for treaty co-productions help explain nearly all of the modest growth in English-language market. It also reveals that most of the growth in audience share in the French-language market can be explained by increases in audiences for distinctly Canadian films. Indeed, whereas Canadian films in the French-language market garnered 21.2% of the domestic box-office share in 2004, with just 4% owing to treaty co-productions. Canadian films in the English-language market captured 1.5%, of which 0.9% was due to audiences for treaty co-productions. This finding reveals that distinctly Canadian English-language films obtained just 0.6% of the domestic box-office in the English-language Canadian market in 2004. In other words, it is very difficult to say that there has been any improvement at the box-office in the English market for distinctly Canadian films since the introduction of the policy.
|
Figure 2.14 |
Box-office shares of Canadian films by film type and market, 2002 to 2004 (%) |
|
|
|
|
|
|
|
|
|
|
Source: Department of Canadian Heritage, Summative Evaluation of the Canadian Feature Film Policy, 2005 |
||
|
Summary of Findings
|
C. CANADIANS’ MOVIE VIEWING HABITS
As noted, a key objective of the Canadian Feature Film Policy is to build audiences for Canadian films. Accordingly, an important part of the Committee’s work has been to identify the extent to which Canada’s Feature Film Policy has achieved this objective. In July 2005 Decima Research, on behalf of the Department of Canadian Heritage surveyed the attitudes and behaviours of Canadians toward Canadian film and music.4 Specifically, the study aimed to determine: awareness of Canadian film and music; levels of satisfaction with Canadian film and music; purchasing behaviours of DVDs and CDs; attendance at movie theatres and live music performances. This section provides key findings from this study as well as from a recently released study by the Canadian Internet Project on Internet usage habits.
How Often and Where Canadians View Movies
Canadians have a number of options for accessing movies. As originally conceived, film was to be viewed on a big screen in a public space, such as theatre or a drive-in. Today, Canadians can view films at home on conventional and speciality television channels, as well as via video-on-demand and pay-per-view services. They can also buy, rent or download films to watch at home, or on personal viewing devices, such as an I-Pod or a cellular phone. In light of these many possibilities, it can be seen why many witnesses and respondents who made submissions to the Committee supported the notion of broadening measurement targets of audiences for Canadian films to include many of these alternate viewing platforms.5
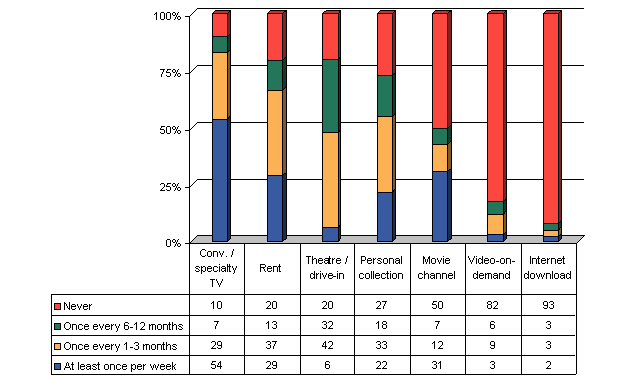
Indeed, as can be seen in Figure 2.15, Canadians are far more inclined to watch movies at home than at a theatre or drive-in. Conventional or speciality television channels seem to be Canadians’ dominant means for viewing movies, with 54% reporting that they do so at least once per week. Another 29% reported watching movies on conventional or specialty television at least once every one to three months. Twenty-nine percent of Canadians reported renting movies at least once per week and 37% reported doing so at least once every one to three months. In addition, 22% said that they watched movies from their personal collection at least once per week, while 33% did so at least once every one to three months.
However, only 6% of Canadians reported watching movies at a theatre or drive-in at least once per week. Forty-two percent reported going to the theatre or drive-in at least once every one to three months. Significantly, 52% of Canadians either never see movies in the theatre or go only once or twice per year.
|
Figure 2.15 |
How often, how and where Canadians view movies (%) |
|
|
|
|
Source: Decima Research, Canadian Film and Music Opinion Study, July 2005 |
|
Respondents were asked to identify the factors that deter them from attending more movies in the theatre. As seen in Figure 2.16, the main reason given was that it is too expensive (41%). Twenty-nine percent cited a lack of basic interest and 25% cited a lack of time as reasons for not seeing more movies in the theatre. A further 21% pointed out that it is inconvenient to go to the theatre to see movies.
|
Figure 2.16 |
Factors that deter Canadians from seeing movies in the cinema (%) |
|||
|
Reason |
Overall |
Quebec |
Rest of Canada |
|
|
Too Expensive |
41 |
29 |
45 |
|
|
Lack of Interest |
29 |
28 |
30 |
|
|
No Time |
25 |
34 |
22 |
|
|
Inconvenient |
21 |
16 |
22 |
|
|
Prefer to Stay home |
10 |
11 |
9 |
|
|
Inaccessible |
4 |
5 |
4 |
|
|
Other Reasons |
17 |
18 |
16 |
|
|
Source: Decima Research, Canadian Film and Music Opinion Study, July 2005 |
||||
Factors that Influence Movie Selection
Respondents were asked to rate the extent to which a series of factors might influence their movie selection at a movie theatre. The level of influence of each factor was expressed using a ten-point scale.6
Storyline, word-of-mouth, and starring actors are the most significant factors that influence Canadians’ movie selection at the theatre. Figure 2.17 indicates that story has the most influence over movie selection at the theatre, with 69% of respondents claiming that it has “significant” or “much” influence. Other leading factors include, word-of-mouth (62%), the actors starring in the movie (58%), and the previews at the theatre (44%). In addition, actors in the movie, critical acclaim and awards, director of the movie, and its country of origin were of significantly greater influences on Quebec residents than those in the rest of Canada.
|
Figure 2.17 |
Factors that affect Canadians’ selection of movies at theatre (%) |
|||
|
Factor |
Overall |
Quebec |
Rest of Canada |
|
|
Story |
69 |
57 |
73 |
|
|
Word-of-mouth |
62 |
58 |
63 |
|
|
Actors in the movie |
58 |
63 |
57 |
|
|
Previews at the theatre |
44 |
44 |
43 |
|
|
Commercials seen on TV |
43 |
41 |
43 |
|
|
Critical acclaim or awards |
33 |
42 |
30 |
|
|
Interviews or news stories about the film |
30 |
36 |
28 |
|
|
Advertising from sources other that TV |
27 |
30 |
26 |
|
|
Director of the movie |
24 |
32 |
21 |
|
|
Country of original of the film |
21 |
29 |
18 |
|
|
Source: Decima Research, Canadian Film and Music Opinion Study, July 2005 |
||||
With respect to factors that influence movie rental selection, Figure 2.18 indicates that 51% of respondents identified content as an important factor: of this amount 26% cited story specifically. Other leading considerations were general awareness of the movie at 38%, with 27% of this amount citing word-of-mouth as important. In addition, 33% of respondents cited factors pertaining to distinction as important.
|
Figure 2.18 |
Factors that affect Canadians’ movie rental selections (%) |
|||
|
Factor |
Overall |
Quebec |
Rest of Canada |
|
|
Content |
||||
|
Story |
26 |
26 |
26 |
|
|
Genre/type |
14 |
18 |
13 |
|
|
Picture/blurb on box |
7 |
12 |
5 |
|
|
Interests me/looks good |
5 |
4 |
6 |
|
|
Other content related reasons |
8 |
10 |
7 |
|
|
Total (Net) |
51 |
56 |
49 |
|
|
Awareness |
||||
|
Word-of-mouth |
27 |
25 |
28 |
|
|
Advertising |
9 |
9 |
9 |
|
|
Previews at the theatre |
6 |
5 |
6 |
|
|
Total (Net) |
38 |
36 |
38 |
|
|
Distinction |
||||
|
Actors in the movie |
23 |
27 |
22 |
|
|
Critical acclaim or awards |
12 |
13 |
12 |
|
|
Director of the movie |
6 |
9 |
6 |
|
|
Total (Net) |
33 |
40 |
32 |
|
|
Other |
||||
|
Store Availability |
10 |
7 |
11 |
|
|
Family |
4 |
2 |
5 |
|
|
Other General Reasons |
20 |
15 |
21 |
|
|
Source: Decima Research, Canadian Film and Music Opinion Study, 2005 |
||||
When asked which factors have the most impact on their movie purchasing decisions, (44%) claimed that they liked the movie so much that they wanted to own it. Also significant were factors relating to the content of the movie (30%), and the distinction of the movie (21%) overall.
Figure 2.19 |
Factors that affect Canadians’ movie purchase selections (%) |
|||
|
Factor |
Overall |
Quebec |
Rest of Canada |
|
|
Movie Enthusiast |
|
|
|
|
|
Like the movie so much I want to own it |
44 |
46 |
43 |
|
|
Other enthusiast related reasons |
4 |
2 |
6 |
|
|
Total (Net) |
45 |
47 |
44 |
|
|
Content |
|
|
|
|
|
Story |
14 |
13 |
14 |
|
|
Genre/type of movie |
8 |
6 |
9 |
|
|
Content of them movie |
6 |
3 |
7 |
|
|
Other content related reasons |
7 |
9 |
6 |
|
|
Total (Net) |
30 |
27 |
31 |
|
|
Distinction |
|
|
|
|
|
Actors in the movie |
12 |
12 |
11 |
|
|
Critical acclaim or awards |
5 |
5 |
6 |
|
|
Classic/old movie |
4 |
5 |
4 |
|
|
Other distinction related reasons |
3 |
5 |
3 |
|
|
Total (Net) |
21 |
24 |
20 |
|
|
Awareness |
|
|
|
|
|
Word-of-mouth |
13 |
9 |
14 |
|
|
Advertising |
3 |
2 |
4 |
|
|
Other awareness related reasons |
6 |
6 |
6 |
|
|
Total (Net) |
18 |
14 |
19 |
|
|
Other |
|
|
|
|
|
Cost |
14 |
9 |
15 |
|
|
Family (Net) |
8 |
7 |
9 |
|
|
Other General Reasons (Net) |
9 |
9 |
9 |
|
|
Source: Decima Research, Canadian Film and Music Opinion Study, July 2005 |
||||
Level of Interest in Types of Movies
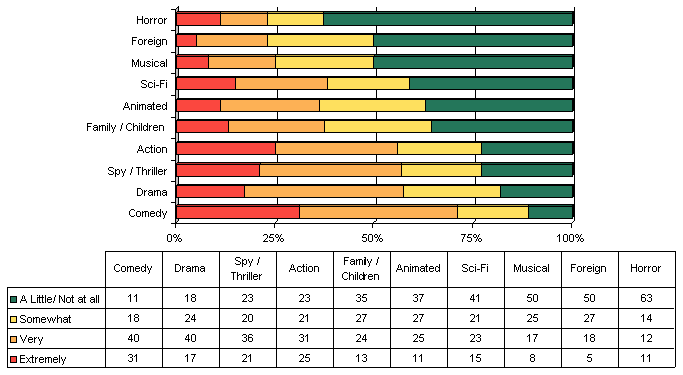
Respondents were asked to state their degree of interest in a variety of film genres. As Figure 2.20 shows, comedy is the most popular movie genre among Canadians, with 71% of Canadians indicating that they were “extremely” or “very” interested. Other leading genres were drama with 57% claiming to be “extremely” or “very” interested, spy/thrillers with 57%, and action with 56%. Least favourite among Canadians were musicals (25%), horror movies (23%), and foreign films (23%).
Figure 2.20 |
Canadians’ interest levels in types of movies (%) |
|
|
|
|
Source: Decima Research, Canadian Film and Music Opinion Study, July 2005 |
|
Awareness of Canadian Feature Film
As seen in Figure 2.21, although Canadians’ overall awareness of Canadian feature films is fairly low, awareness among Quebec residents is significantly higher than those in the rest of Canada. To gauge awareness of Canadian films, respondents were presented with a list of 17 recent Canadian films and asked if they had heard of them.7 Of the 17 listed, on average, Canadians were aware of 6 films, with 67% showing a high level of awareness, 18% showing a medium level of awareness, and 15% showing a low level of awareness. While residents of Quebec were aware of an average of 9 of the 17 movies, with 92% showing high awareness, only 58% of those in the rest of Canada showed high awareness: 5 films on average.
|
Figure 2.21 |
Canadians’ awareness of Canadian feature films (%) |
|
|
|
|
Source: Decima Research, Canadian Film and Music Opinion Study, July 2005 |
|
Viewership of Canadian Feature Film
In a similar manner to awareness, overall viewership of Canadian feature films is quite low, though again, viewership among Quebec residents is considerably higher than those in the rest of Canada. As Figure 2.22 shows, Canadians reported having seen only 2 of the 17 films listed in the survey, with only 16% showing a high level of exposure (5 or more films) and 67% showing a low level of exposure (2 or fewer films).
|
Figure 2.22 |
Canadians’ viewership of Canadian feature film (%) |
|
|
|
|
Source: Decima Research, Canadian Film and Music Opinion Study, July 2005 |
|
Attitudes Towards Canadian Feature Film
Canadians were asked about the extent to which they agreed8 with a number of statements about Canadian film, including the following: “I think it is important that Canadian movies can be seen in movie theatres in Canada”, and “I think it is important that Canadian movies can be seen on Canadian television.” The vast majority of Canadians agree that it is important that Canadian films be available in movie theatres in Canada, as well as on Canadian television 84% and 83% respectively. It should be noted, however, that residents of Quebec showed significantly higher levels of agreement with these statements than those in the rest of Canada.
Canadian films seem to have fairly low visibility among most Canadians. Respondents were presented with the statements: “Most Canadian films are not available in movie theatres”, and “Most Canadian films are not available in video stores.” Forty-two percent of Canadians agreed that most Canadian films are not available in movie theatres, and another 30% were neutral on the question (evidently not knowing either way). Thirty-one percent of Canadians agreed that most Canadian films are not available in video stores, and another 33% did not know. Canadians were also presented with the statement: “More people would watch Canadian movies if they were promoted and advertised better.” Seventy-two percent of Canadians were in agreement.
Canadians were also presented with a number of statements regarding the quality of Canadian feature films. When presented with the statement: “Over the last couple of years, I think that the Canadian movie industry has begun to make better films”, 68% of Canadians agreed. That said, whereas 81% of Quebec residents agreed with the statement, 64% from the rest of Canada agreed.
When presented with the statement: “The acting, directing and production quality of Canadian movies is as good as movies made in other countries”, 62% of Canadians agreed, 23% were neutral, and just 15% somewhat disagreed or strongly disagreed. Again, however, residents of Quebec had more positive attitudes toward Canadian films, with 72% agreeing that the acting, directing and production quality of Canadian movies is as good as movies made in other countries.
Interestingly, though Canadians may have favourable views on the quality of Canadian films, they do not feel that the stories in these films relate to them. Only 28% of Canadians agreed with the statement: “The stories in Canadian films relate to me,” with 35% remaining neutral. Even residents of Quebec displayed doubts about the relevance of the stories in Canadian films, with only 37% agreeing with the statement.
|
Figure 2.23 |
General attitudes toward Canadian film (%) |
|||
|
|
Overall |
Quebec |
Rest of Canada |
|
|
I think it is important that Canadian movies can be seen in movie theatres in Canada |
84 |
91 |
81 |
|
|
I think it is important that Canadian movies can be seen on Canadian TV |
83 |
86 |
82 |
|
|
More people would watch Canadian movies if they were promoted and advertised better |
72 |
70 |
73 |
|
|
Over the last couple of years, I think that the Canadian movie industry has begun to make better films |
68 |
81 |
64 |
|
|
The acting, directing and production quality of Canadian movies is as good as movies made in other countries |
62 |
72 |
59 |
|
|
Most Canadian films are not available in movie theatres |
42 |
30 |
47 |
|
|
American movies are better made than movies made in other countries |
38 |
34 |
39 |
|
|
Most Canadian films are not available in video store |
31 |
27 |
32 |
|
|
The stories in Canadian movies relate to me |
28 |
37 |
25 |
|
|
Source: Decima Research, Canadian Film and Music Opinion Study, July 2005 |
||||
Canadians, Movies, and Information Technologies
With the advent of the Internet and the increasing availability of high speed access, more Canadians can download movies and watch them on their home computers than ever before. The Internet is also a means by which people can get information about movies through downloading and watching trailers, reading reviews, etc. A study was conducted in May-June 2004 by the Canadian Internet Project to explore how online technologies are changing the lives of Canadians.9
Currently, very few Internet users (and, of course, even fewer Canadians in general) watch movies online. As seen in Figure 2.24, of those respondents who are Internet users, only 4.7% reported using it as a means to watch movies. In light of potential copyright violations committed by those who share and download movies via the Internet, it is quite probable that some Internet users who access films via online sources do not report doing so. Whatever the case, it is certain that as information technology continues to become cheaper, faster, and more user-friendly, many more people will be using the Internet to access and watch movies.
|
Figure 2.24 |
Canadians’ reported frequency of access to selected online services (%) |
|
|
Activity on the Internet |
Incidence |
|
|
Reading newspapers/magazines |
54.5 |
|
|
Source: Canadian Internet Project, Canada Online!, October 2005 |
||
The data in Figure 2.25 further illustrate the extent to which the Internet’s importance as a communications carrier for film and film culture will increase in the years to come. Respondents were asked to state how important the Internet is to them as a source of entertainment.10 Young people (respondents 18-34 years of age) were more than three times as likely as those 55 years of age and older to view the Internet as important for entertainment.
|
Figure 2.25 |
Importance of the Internet for Canadians as a source of entertainment by age (%) |
|
|
|
|
Source: Canadian Internet Project, Canada Online!, October 2005 |
|
While the Internet may not currently be widely used to watch movies, it is widely used by Canadians as a means to get information about movies. Canadians who reported using the Internet were asked if they had visited websites dealing with a variety of subjects in the past three months. As Figure 2.26 shows, 45% reported having visited a website dealing with movies some time in this period. In fact, more Canadians reported visiting movie related websites than sites dealing with music, concerts, sports, cultural events, books, and cooking, among other things.
|
Figure 2.26 |
Types of websites most frequently accessed by Canadians by theme (%) |
|
|
|
|
Source: Canadian Internet Project, Canada Online!, October 2005 |
|
|
Summary of Findings The survey data presented here highlight a number of interesting factors that give pause for consideration when contemplating the best ways to build audiences for Canadian film. The following key points stand out:
|
| 3 | Most of these films were French-language productions. |
| 4 | Decima Research used a computer-assisted telephone interview to survey a total of 2002 Canadians within the general population aged 15 an older. Because of the success of the film industry in the Quebec market, 750 of the interviews were collected from Quebec residents to obtain a sample for more detailed analysis. The statistical margin of error (at a 95% level of confidence) for each question asked is +/- 2.2%. |
| 5 | See Chapter 3. |
| 6 | 9-10 on the scale represented “significant influence”, 7-8 “much influence”, 5-6 “some influence”, 3-4 “little influence”, and 1-2 “none.” The percentages displayed in Figures 2.17, 2.18 and 2.19 represent the percentage of respondents who rated a factor as having “significant” or “much” influence. |
| 7 | Respondents were categorized based on their level of awareness of Canadians feature films, with “high awareness” being 5 or more films, “medium awareness” being 3 to 4 films, and “low awareness” being 2 or fewer films, based on the feature films listed in the survey. |
| 8 | Respondents could "strongly agree", "somewhat agree", be "neutral", "somewhat disagree", or "strongly disagree." The percentages shown in Figure 2.23 represent the percentage of respondents who either "strongly agreed" or "somewhat agreed" with the statement. |
| 9 | A total of 3,014 Canadians aged 18 and older were surveyed over the telephone. 2,011 of the interviews were conducted in English by Research House in Toronto, 1,003 were conducted in French by CROP in Montreal. The statistical margin of error is 1.8%, 19 times out of 20. |
| 10 | On a scale of 1 to 5 with 1 meaning "not important at all", 5 meaning "extremely important", and 3 meaning "moderately important." |
