INST Committee Report
If you have any questions or comments regarding the accessibility of this publication, please contact us at accessible@parl.gc.ca.
CHAPTER 2: THE INNOVATION RECORD
Today’s knowledge-based economy — although really still in its infancy — is a fast-paced one spurred by product and process innovation. Anecdotal evidence is all around us. Product lifecycles are becoming shorter and shorter all the time; for example, the average life of a personal computer model on the market today is no more than six months; for computer software, it is about six months; and for semiconductors, it is about one to two years. Even our more traditional products are undergoing rapid transformation. For instance, automobile models that used to last about a decade without major design changes are now being almost entirely revamped about every four to six years. The lifetime of a typical aircraft model has declined from about two decades to somewhat less than one. The same can be said about your standard utility services, like telephone and financial services, that have been complemented by an array of value-added features.
Innovation is taking place in every industry. The form this takes varies dramatically, from minor changes and products that are primarily cosmetic to the development of brand new products that are world firsts. Admittedly, at any point in time innovation may be more intense in some places. But in every industry, there are innovative firms that introduce new products and new processes, or both simultaneously. [John Baldwin; 13, 9:11]
Not surprisingly, new information technologies resulting from the digital micro-processing revolution are often the dynamo driving many of these changes. However, this is not the sole source of change; major breakthroughs in genetics research, which are at the heart of the biotechnologies revolution, are increasingly altering the productivity and quality of our food and health systems. The Committee goes into greater detail on the futurist possibilities in Chapter 5.
Moving beyond this anecdotal evidence, the measurement of the speed of innovation within in any society is a more difficult undertaking. It is obvious to most people that as resources spent on producing more knowledge increase, so too does the rate at which we expand the frontiers of knowledge (scientific discoveries, inventions). However, it is less obvious to most that the efficiency of the entire "innovation system" also positively influences the speed of innovation. Part of the problem stems from the fact that, for S&T activities, it is far harder to measure output than input. Whereas an input such as R&D can, in general, be measured in monetary terms or by "head counts," the valuation of output is fraught with difficulties because: (1) it is more diverse; (2) it is often obtained indirectly or is embodied in a wider array of product and service packages that are priced as a bundle; and (3) it is sometimes without any monetary counterpart due to the lack of an active marketplace, such as for many environmental, health and education goods and services.
[I]nnovation is heterogeneous. Innovation consists of different types of outputs. Innovation intensity differs across industries, and it differs across actors. There’s no single dimension that dominates others, but there are some that are more important than others. [John Baldwin; 13, 9:11]
In this case, standard procedure has been to use an output of R&D to substitute for the real output of innovation. Scientific publications and patents, which are really intermediate inputs to innovation, are thus used as surrogate measures of scientific discoveries and new technologies, respectively, but caution should be observed, as they are really partial and imperfect indicators.
Figure 2.1
Source: OECD, Main Science and Technology Indicators, No. 1, 2000.
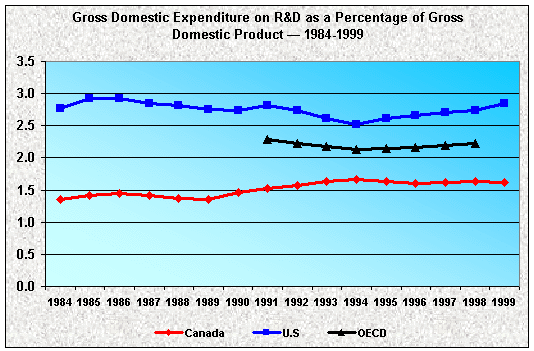
The Committee will first deal with the inputs to innovation and will next move on to the efficiency of the innovation system. In terms of inputs, gross domestic expenditure on R&D (GERD) as a percentage of gross domestic product (GDP) remains the best indicator. Figure 2.1 displays this R&D input for Canada, our toughest competitor country (the United States), and the OECD over most of the past two decades. The figure indicates that relative R&D funding across OECD countries shows no discernible trend, upwards or downwards, fluctuating about 2.2% of GDP. In absolute terms, this expenditure amounted to US$518.3 billion (using the OECD’s purchasing power formula to consolidate it in one currency) in 1998. Canadian and American performances mimic that of the OECD, though their averages are different: 1.5% of GDP for Canada and 2.8% for the U.S.
Figure 2.2
Source: OECD, Science, Technology and Industry Outlook, 2000.
In terms of research outputs, the Committee will first deal with scientific discoveries as estimated by scientific publications, followed by technological inventions as estimated by patent applications.
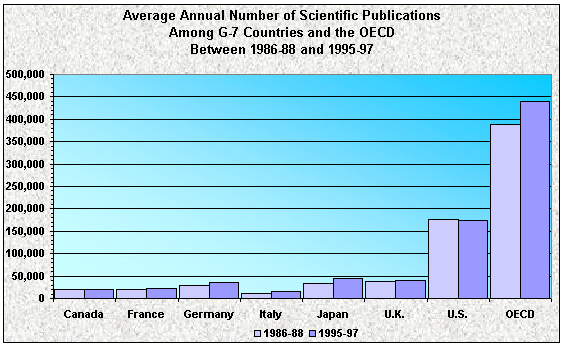
Each new scientific publication holds the promise of expanding some frontier of knowledge. Yet only an increased number of publications on an annual basis offers the prospect for an increased rate of knowledge production and, indirectly, a faster speed of innovation (assuming for sake of simplicity that each article yields a similar benefit to society). As such, Figure 2.2 indicates that the annual number of scientific publications, estimated at 438,966 between 1995-1997, is relatively unchanged from 1986-1988 in most G-7 countries, Japan being a slight exception. Only the smaller economies of the OECD are showing signs of raising the productivity in their research activities. The Committee must therefore conclude that the efficiency of the scientific community has not changed; both outputs and inputs of scientific knowledge are roughly the same between the 1980s and 1990s.
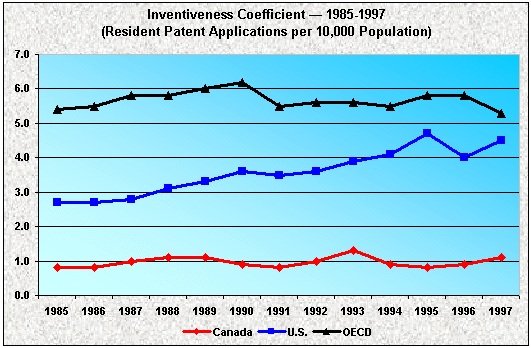
In terms of technological innovation, Figure 2.3 tracks the OECD’s Inventiveness Coefficient, defined as a country’s resident patent applications per 10,000 population, between 1985 and 1997 for Canada, the U.S., and the OECD. This indicator of an innovation system’s efficiency also suggests a rather flat performance across the OECD, including Canada, with the United States improvements offsetting other OECD country deteriorations — though the latter conclusion may be premature.
Figure 2.3
Source: OECD, Main Science and Technology Indicators, No. 1, 2000.
Given the apparent diverging U.S. performance in terms of resident patent applications with that of other OECD countries for such a long period, more scrutiny of the results is warranted. It must be noted that, in the early 1980s, several U.S. Federal Court initiatives and decisions bolstered the U.S. patent system, along with legislative changes that expanded patent eligibility to include software, business practices and higher lifeforms. These Court initiatives not only unified the judicial treatment of patent rights across the country, they transformed the legal environment from one that was generally sceptical of patents to one that promoted the broad exclusive rights granted to patent holders. The Court also made it more difficult to challenge a patent’s validity by raising the evidentiary standard, along with showing a greater willingness to grant preliminary injunctions to patentees during ongoing infringement suits. Hence, the observed greater propensity to patent in the U.S. may not then be the result of some greater R&D productivity, but rather is an indication that the pro-patent court initiatives triggered a "patent race" in the United States. The motivations for such a race could be twofold: (1) the larger companies of industries characterized by cumulative product and process innovation, such as the semiconductor, computer hardware, machinery and equipment, electronics, etc., were "harvesting" their past research more intensively to use them strategically in the negotiation of use rights with other holders of complementary patents; and (2) small, innovative start-ups across all industries required patents to obtain venture capital on better terms, or to obtain these funds when they otherwise could not. These possible explanations further corroborate the need to show caution when using these measures as indicators of innovation. Indeed, the quality of each patent claim likely declined with the more intensive harvest.
In summary, based on both the amount of inputs devoted to R&D and the efficiency of their use within the R&D activity across the OECD, the evidence suggests that there has been no increase in the speed of innovation throughout the 1990s. R&D inputs and the ratio of R&D outputs to R&D inputs are unchanged in the last decade across the OECD. The anecdotal evidence to the contrary implies that there must be other external factors at work. As such, the Committee draws on its observation that the globalization phenomenon is pervading most other business activities and turns to evidence of increased international diffusion of innovation and research cooperation as a possible explanation for the perceived increased rate of innovation.
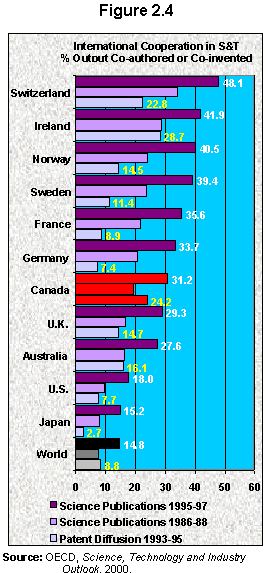
Figure 2.4 provides us with some indication of the increased international cooperation in
the S&T research community. Throughout 1995-1997, scientific publications across the
world listing a foreign co-author averaged 14.8%, up from 7.8% in 1986-1988. In other
words, this type of cooperation more than doubled in less than a decade. While surpassed
by most continental European countries, Canada — with 31.2% of its
scientific publications citing a foreign co-author — places well on this
measure of international cooperation; it is more than twice the rate around the world. In
terms of patents around the world, 8.8% cited a foreign co-inventor in 1993-1995. Again,
Canada places well above the world average — some three times
higher — and is only surpassed by Ireland.
The number of national patents filed in OECD countries each year between 1985 and 1997 has increased at an average annual compound rate of 14.3%; yet applications by residents of each country increased only at a rate of 2.5% in this period. This suggests that patentees are increasingly applying for protection beyond their domestic borders and the statistics confirm the above inference. The OECD reports the patent dependency ratio (non-resident-to-resident patent applications) throughout the OECD has increased from 0.99:1 in 1985 to 3.16:1 in 1997, while the rate of diffusion of patents (external-to-resident patent applications) within the OECD, as shown in Figure 2.5, increased from 1.8:1 in 1985 to 6.15:1 in 1997.
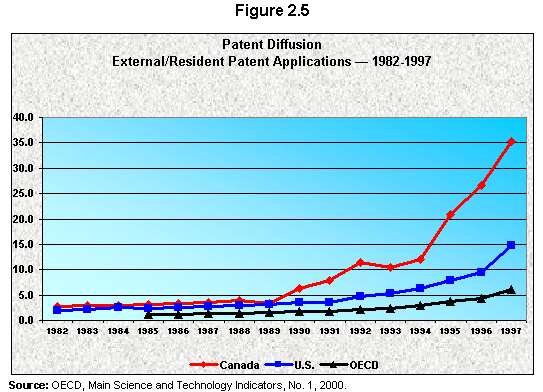
Figure 2.5 also demonstrates that Canada has, more than the U.S. and the OECD countries, on average, been at the forefront of this globalization wave. Perhaps these international cooperation performances provide the statistical evidence in support of anecdotal evidence of an increased rate of innovation, at least as is perceived by Canadians. If this conclusion is indeed correct, each country’s innovation system has on average remained the same — though it may be more specialized — and the acceleration in innovation is due solely to efficiency gains resulting from the S&T community going global.
Canada’s innovation record, as was shown in many of the previous section’s graphs, has been steady and is by and large unchanged — as has been the case for most OECD countries. These graphs offered a time profile of our innovation system’s performance from the late 1980s through the 1990s. In terms of R&D as a percentage of GDP, in terms of scientific publications, and in terms of the resident-patent-applications-to-population ratio, the status quo has been maintained. Except in terms of international cooperation, Canada’s innovation system at the turn of the twenty-first century is much as it was in the 1980s.
In this section, the Committee would like to ascertain Canada’s relative position or rank within the OECD. Again, the principal indicator of inputs into the innovation system is GERD per GDP dollar. Figure 2.6 places Canada ninth among the 12 OECD countries considered. With a GERD-to-GDP ratio of 1.64%, Canada is well below the OECD average of 2.23% in 1998. Although tied with Australia, Canada outperforms only Ireland and Italy. Finally, R&D conducted by the business sector (BERD) and higher education facilities (HERD) show similar performances and rankings.
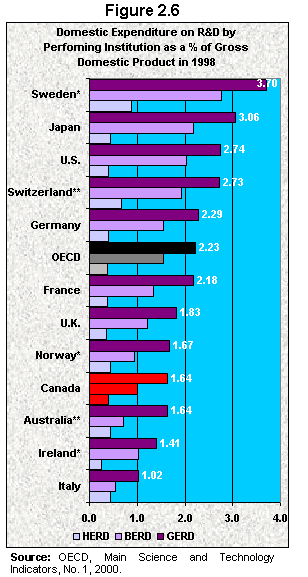 What to make of Canada’s
relatively poor R&D position has been a perennial concern of many commentators in the
past. This Committee will only remark on a couple of observations. First, while large
economies such as the United States, Germany and Japan are expected to rank near the top
because they can spread these overhead costs more widely than other countries, it is
surprising that Sweden, the top-ranked performer, and Switzerland placed so well. This
suggests that, while the size of an economy is a positive factor in encouraging R&D,
the lack of economic size does not form an insurmountable barrier to being a successful
R&D performer. Second, a common characteristic of those situated at the top, except
the U.S., is that they are geographically small countries, suggesting a relative lack of
natural resources. This scarcity has necessitated the pursuit of economic strategies
almost diametrically opposed to that of Canada, which is to exploit its comparative
advantage in natural resources. These smaller countries have instead pursued a strategy of
comparative advantage in innovative industries requiring bountiful investments in R&D
and human capital. In the end, Figure 2.6 clearly demonstrates that should Canada
decide to shift its strategy of comparative advantage from natural resource industries and
towards innovative and knowledge-based industries, the only thing standing in the way is
the country’s will.
Other commentators have also noted the implications of these contrasting economic strategies. To effectively exploit its natural resource bounty, Canada has required considerable capital — the natural resource sector is very capital intensive both absolutely and relatively — making its importation critical. Foreign capital dependency translates into an economic structure characterized by many foreign-owned manufacturing plants and this has implications for Canada’s relative R&D performance and ranking.
I offer a word of caution … It’s widely known that R&D is not done intensively in Canada. The ratio of R&D expenditures to GDP is lower in Canada than in many other OECD countries. But that does not mean our industry lags behind other nations in terms of our ability to benefit from the knowledge gained from R&D. We have to recall that over half of Canadian manufacturing industries are foreign owned, and foreign-owned plants in Canada benefit from the R&D done abroad by their parents. Indeed, if you take into account both domestic R&D spending and what our plants pay for R&D done abroad, Canada increases its R&D ranking substantially. [John Baldwin; 13, 9:25]
The structure of one’s industrial sector has other implications for cross-country comparisons of the GERD-to-GDP ratio:
It should be noted that comparison on simple R&D to GDP ratios across the country is also misleading if corrections are not made for the different industrial structures of countries. Innovation regimes differ across industries. Studies have shown that there are some industries, like electronic industries and machinery, … they’re at the core of the innovation system. They do a large amount of R&D and they produce more innovations ... Others, such as food products use new materials and machinery from the core sector and tend to expend money not on R&D, but technological and engineering, and production systems. The two sectors work together in a symbiotic relationship. … Some countries have more of the former, other countries have more of the latter, and those countries such as Canada that concentrate more on the latter will simply have low R&D ratios because of that, even if they have a highly innovative industrial sector. [John Baldwin; 13, 9:25]
This suggests that Canada’s poor business R&D performance is not necessarily a cause of any innovation problem the country may have, but is a symptom our industrial structure being focused — and probably too focused — on exploiting its natural resource base. This view is somewhat corroborated by an OECD study that indicates that Canada was unique among the OECD in that its increase in R&D intensity across its business sector in the 1990s was due almost entirely to a shifting industrial structure towards high-technology industries, whereas the R&D-intensity changes (some positive, some negative) of virtually every other country of the OECD were within-industry effects.2 Canada’s industrial structure has thus been undergoing more change than other countries in the 1990s.
For these reasons, there is a danger in policy-makers being too focused on input measures of innovation such as R&D:
[W]e should always be cautious about using input measures like R&D to GDP ratios … when we come to evaluate ourselves against other countries. After all, the ratio of R&D to GDP is the ratio of an input to total output. It’s not obvious that we want to try to maximize the ratio of inputs to outputs. Do we want to try to maximize the amount of transportation expense we have, or the amount of labour we have? If we did, of course that would mean we’d want low labour productivity ratios ... We really want to maximize the output of the process relative to the inputs, or minimize the ratio of an input to an output. In some sense, having a strong prosperous economy that accomplishes much with less, including R&D, should be out ultimate goal. [John Baldwin; 13, 9:25]
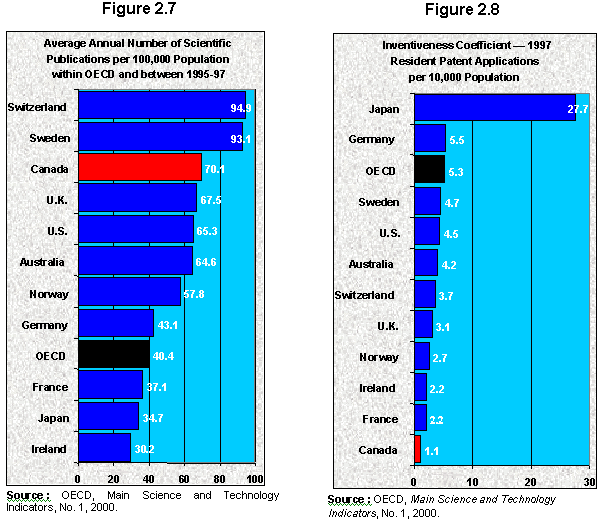
Moving on to R&D outputs such as scientific discoveries and technological inventions, the Committee again uses their surrogate measures, scientific publications per 100,000 population and resident patent applications per 10,000 population, respectively. Figure 2.7 ranks Canada third among the 11 OECD countries considered in terms of the number of scientific publications. Canada is a top performing S&T country; apparently, Canada has distinguished itself in clinical medicine and biomedical research.
Figure 2.8, on the other hand, places Canada in last place of 11 OECD countries in terms of resident patent applications, and thus reinforces Canada’s poor R&D showing. However, the Committee was again cautioned against making too much of these statistics:
While R&D is not done intensively in Canada — and the R&D ratios are often quoted as indicating we have major problems — this should not be interpreted to mean that the Canadian scientific community is in some sense ineffective. There’s ample evidence showing that Canadian universities that engage in R&D have a very successful output and that the number of papers produced and the number of patents are all relatively high when compared with the number of people in universities. You can use the same yardstick to judge the effectiveness of R&D in Canada. If we create an index of the number of patents taken out in U.S. markets per R&D scientist in the home country, and calculate such a measure for Canada and most European countries, we sit right in the middle of the pack. Our R&D scientists are relatively effective. [John Baldwin; 13, 9:25]
These data only confirm the Committee’s view that it is not the level of R&D per se which will determine our innovation capabilities; rather it is the management of the limited R&D we do undertake which is particularly important and has had the greatest impact on the pace of innovation. However, as we alluded to in Chapter 1, Canada is missing out on the many indirect benefits of R&D because of low R&D activity levels and, as suggested in this chapter, lower R&D levels may be the result of an anomalous industry structure; it should be noted that this structure is currently undergoing significant change for the better. With a view to increasing the rate of change in Canada’s industrial structure towards one that is consistent with a knowledge-based economy, the Committee recommends:
2. That the Government of Canada design and adopt a public policy instrument that specifically targets and encourages R&D-intensive industries to invest in Canada.
