INDY Committee Report
If you have any questions or comments regarding the accessibility of this publication, please contact us at accessible@parl.gc.ca.
TRENDS IN RESEARCH AND DEVELOPMENT FUNDING
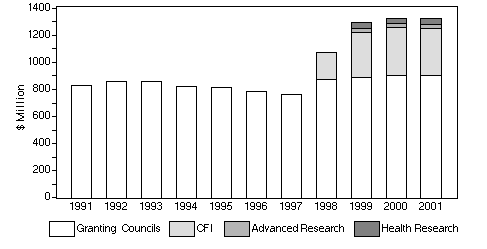
The mid 1990s were a period of reduced funding for the granting councils. Figure 1 shows the total allocations of the three granting councils according to the Main Estimates. The 1999 Budget contained new funding for health research of $27.5 million for the MRC and $7.5 million each for NSERC and the SSHRC for each of the next three years. In addition NSERC and the SSHRC will receive an additional $25 million and $5 million respectively for advanced research for each of the next three years.
Figure 1
Granting Council Funding, Current $
Source : Main Estimates, Budget Papers, CFI
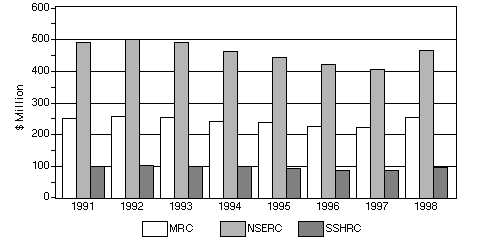
The depth of the reductions in real terms (1992 dollars) is shown in Figure 2. In the fiscal year 1996-97, the main estimates for NSERC and the SSHRC were 84% of the corresponding amounts they received in 1992-93. The corresponding figure for the MRC was 89%.
The allocations to the granting councils have followed a timepath very similar to overall federal spending on science. The government supports two types of scientific and technological (S&T) activities, R&D and related scientific activities (RSA). Most of the funding for the social sciences and humanities is spent on RSA such as data collection, information services and operations and policy studies. Statistics Canada accounts for a third of these expenditures. About three quarters of federal S&T spending is in the areas of natural sciences and engineering and about three quarters of this is for R&D. The federal government performs half of its own R&D intramurally and three quarters of its own RSA. Table 1 shows federal S&T and R&D spending in constant dollars, as well as a measure of total federal spending, budgetary main estimates.
Figure 2
Granting Council Funding in 1992 $
Source : Main Estimates

![]()
Source: Statistics Canada - Cat. No. 88-204 XIB Federal Scientific Activities,
1998-99. TABLE 1.1
As Table 1 shows, science and technology and research and development have not been cut disproportionately. The figures above do not include the value of the federal R&D tax credits, which are currently worth over $1 billion.
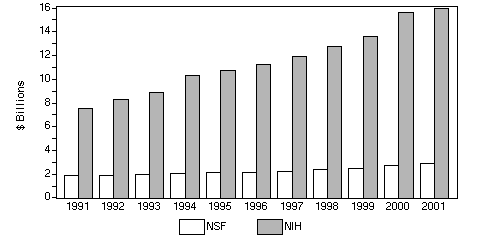
The United States granting councils experienced a steady growth in funding during the 1990s. The National Science Foundation (NSF) funds both natural and social sciences. The National Institute of Health (NIH) is the equivalent of the MRC.
Figure 3
NSF and NIH Spending US$ (current)
Source : OMB
During the period shown, NSF funding grew by nearly 5% per year, while NIH funding increased at a rate of 8% per year. United States research funding has increased steadily. With a bigger stock of research on its shelves, the United States has a greater potential to innovate and produce new products and services. The greater stability of the United States research environment and the steadier prospects for personal advancement are very attractive to bright Canadian students and star researchers.
Academia is only one of the producers of research and development. International comparisons of Canada's R&D performance show that there is a need for improvement. The standard measure of a country's R&D effort is the summary statistic Gross Domestic Expenditures on R&D or GERD, and is all R&D performed in a country's national territory during a given year. The GERD includes R&D performed within a country and funded from abroad but excludes payments sent abroad for R&D performed in other countries. GERD is often expressed as a ratio of GDP to facilitate international comparisons of the levels of effort devoted to R&D. As a pure ratio the difficulties of constantly fluctuating exchange rates among international currencies are circumvented. This ratio has become a standard statistic, but it is influenced by factors not related to the capacity of the business sector to innovate. Countries with larger military spending, for example the United States, tend to have high GERD to GDP numbers.


Source: OECD and Statistics Canada No. 88-001-XIB
At 1.58% of Gross Domestic Product in 1997, Canada's R&D effort changed little from the 1996 figure of 1.57%. This ratio is lower than that of all G-7 countries, except for Italy at 1.03%. Analyzing trends in international data must be done with some caution. A ratio can change because of movements in both top and bottom lines of the fraction. For example, a sudden spurt in national income will cause GERD/GDP to decrease. Long term reductions in military spending, as in the United States, will tend to be associated with a decline in the GERD/GPD ratio.
Looking behind the trend in GERD/GDP in Canada shows that the various sectors perform differently. R&D spending by industry has been growing the fastest, with real annual increases of 6.6% per year.
This has been accompanied by a strong increase in the share of GERD financed by industry from only 38.4 in the early 1960s, to 63.4 percent in 1997. In 1997, R&D spending by industry was less than one percent of GDP in Canada compared to 1.96% in the United States. Both the university and government spending on R&D has increased at a much slower rate than industry and, indeed in real terms has declined in the mid 1990s.
Statistics Canada estimates the amount of R&D done in the higher education sector, defined as universities, colleges of technology and other institutes of post-secondary education, including their research institutes, experimental stations and clinics. Data is gathered from the Canadian Association of University Business Officers (CAUBO) annual survey. In the 1996-97 survey, forty eight institutions undertook R&D. Measurement problems arise because university teachers have responsibilities to educate, research and serve the community, and one salary covers all three activities. Research is not a centrally organized and recorded activity but more of a personal pursuit. External grants and funds are usually recorded, but not faculty time.
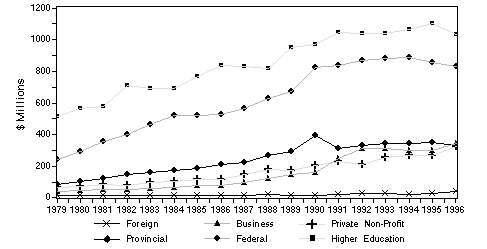
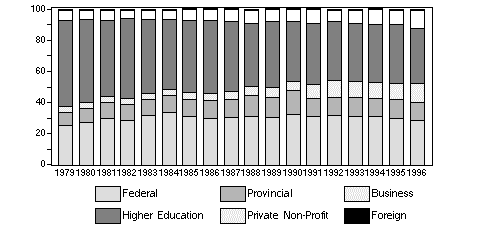
Statistics Canada follows a number of stages. Firstly, Statistics Canada distributes total costs for each institution between the major fields of science according to the weighted number of full-time teachers in each field. This takes into account the different use of part-time teachers, and the heavier needs of experimental sciences. For example, teachers in the Agricultural & Biological Sciences, Engineering and Applied Sciences, and Math and Physical Sciences use twice as many resources as humanities teachers. The resulting percentage distribution of the weighted number of full-time teachers by teaching field is then applied to the total costs of each institution to provide the total expenditures by teaching field. In the absence of actual time budget surveys in Canadian universities, Statistics Canada uses plausible ratios to estimate the R&D portion of the total expenditures by field for each institution. Different ratios are used for the high, medium and low research producing universities. Figure 4 shows the changing trends in financing R&D in higher education institutions. The federal and provincial items refer to direct research grants made by these governments, including their granting councils. The general funding that universities receive as part of the transfer payments system is included in the Higher Education item.
Figure 4
Higher Education Sector R&D
By Source of Funds 1979-1996
Source : Statistics Canada 88-001-XIB Vol 22 No 7
Figure 4 illustrates the decline in the mid 1990s of direct federal and provincial research funding and of the general revenues that universities have devoted to research. Business and non-profit financing, as well as foreign funding, have continued to grow in current dollar terms. Figure 5 shows the same data in share terms. There is a decreasing availability of public sourced funds and an increasing reliance on business and non-profit institutions to finance university research.
Figure 5
Higher Education Sector R&D
By Source of Funds, 1979-80 to 1996-97
Source : Statistics Canada 88-001-XIB Vol 22 No 7
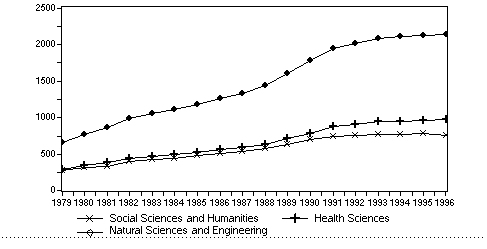
As stated before, business is often characterized as being more interested in late stage research that is close to commercialization. Unfortunately there is no data available to look at the effects of the shifts in funding sources on the type of research undertaken. However there is a decomposition by discipline.
Figure 6
R&D in Higher Education by Discipline
Source : Statistics Canada 88-001-XIB Vol 22 No 7
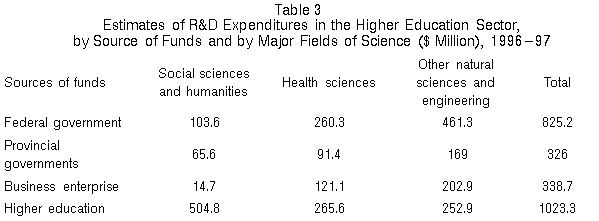
As measured by Statistics Canada, Figure 6 illustrates the absolute decline in current dollars of university research in the humanities and social sciences in 1996. Table 3 shows a cross-tabulation by research field and by source of funding. The federal and provincial governments and the business sector devote more than fifty percent of their funding to the natural sciences and engineering. However, one half of the higher education sector funding goes to social sciences and humanities, and this makes up sixty-eight percent of the funding social sciences and humanities receive. When core budgets decline, the effects on different fields of research are not uniform.

Statistics Canada 88-001-XIB Vol. 22, No. 7