LIAI Committee Report
If you have any questions or comments regarding the accessibility of this publication, please contact us at accessible@parl.gc.ca.
Committee Activities and Expenditures Summary
Summary of Committee Activities (April 1, 2019 to March 31, 2020)
The following tables contain information about all committee meetings, witnesses and reports for the period from April 1, 2019 to March 31, 2020. Committees are listed in alphabetical order of standing committee names. Each standing committee is followed by separate rows for each of its subcommittees (if applicable). For general information on the following tables, see the “Note to Reader – Meetings, Witnesses and Reports”.
Standing Committees and Subcommittees
Standing Committees and Subcommittees |
Total Number of Meetings |
Number of Televised Meetings |
Number of Meetings with Video-conferencing |
Number of Meetings with Video Recording |
Total Meeting Hours |
Number of Witnesses |
Number of Reports |
Access to Information, Privacy and Ethics (ETHI) |
25 |
17 |
7 |
0 |
41h23m |
112 |
3 |
Subcommittee on Agenda and Procedure (SETH) |
2 |
0 |
0 |
0 |
1h38m |
0 |
0 |
Agriculture and Agri-Food (AGRI) |
22 |
3 |
6 |
0 |
35h26m |
78 |
3 |
Subcommittee on Agenda and Procedure (SAGR) |
0 |
0 |
0 |
0 |
0h0m |
0 |
0 |
Canadian Heritage (CHPC) |
18 |
2 |
4 |
0 |
28h55m |
44 |
3 |
Subcommittee on Agenda and Procedure (SCHP) |
0 |
0 |
0 |
0 |
0h0m |
0 |
0 |
Citizenship and Immigration (CIMM) |
23 |
7 |
7 |
0 |
38h52m |
91 |
3 |
Subcommittee on Agenda and Procedure (SCIM) |
1 |
0 |
0 |
0 |
1h17m |
0 |
0 |
Environment and Sustainable Development (ENVI) |
23 |
7 |
5 |
0 |
36h42m |
130 |
4 |
Subcommittee on Agenda and Procedure (SENV) |
2 |
0 |
0 |
0 |
1h17m |
0 |
0 |
Finance (FINA) |
38 |
20 |
9 |
0 |
90h09m |
358 |
4 |
Subcommittee on Agenda and Procedure (SFIN) |
2 |
0 |
0 |
0 |
0h30m |
0 |
0 |
Fisheries and Oceans (FOPO) |
21 |
1 |
7 |
1 |
34h45m |
91 |
8 |
Subcommittee on Agenda and Procedure (SFOP) |
0 |
0 |
0 |
0 |
0h0m |
0 |
0 |
Foreign Affairs and International Development (FAAE) |
21 |
5 |
10 |
2 |
32h14m |
53 |
10 |
Subcommittee on Agenda and Procedure (SFAA) |
2 |
0 |
0 |
0 |
2h21m |
0 |
0 |
Subcommittee on International Human Rights (SDIR) |
20 |
8 |
8 |
0 |
19h56m |
33 |
0 |
Government Operations and Estimates (OGGO) |
20 |
1 |
4 |
0 |
31h38m |
137 |
3 |
Subcommittee on Agenda and Procedure (SOGG) |
1 |
0 |
0 |
0 |
0h41m |
0 |
0 |
Health (HESA) |
26 |
5 |
10 |
1 |
48h50m |
123 |
7 |
Subcommittee on Agenda and Procedure (SHES) |
1 |
0 |
0 |
0 |
0h54m |
0 |
0 |
Subcommittee on Sports-Related Concussions in Canada (SCSC) |
6 |
3 |
1 |
0 |
10h26m |
16 |
0 |
Human Resources, Skills and Social Development and the Status of Persons with Disabilities (HUMA) |
16 |
2 |
1 |
0 |
27h19m |
37 |
4 |
Subcommittee on Agenda and Procedure (SHUM) |
1 |
0 |
0 |
0 |
0h56m |
0 |
0 |
Indigenous and Northern Affairs (INAN) |
20 |
4 |
8 |
2 |
47h27m |
156 |
5 |
Subcommittee on Agenda and Procedure (SINA) |
2 |
0 |
0 |
0 |
1h12m |
0 |
0 |
Industry, Science and Technology (INDU) |
23 |
5 |
3 |
0 |
37h39m |
61 |
4 |
Subcommittee on Agenda and Procedure (SIND) |
0 |
0 |
0 |
0 |
0h0m |
0 |
0 |
International Trade (CIIT) |
25 |
13 |
9 |
0 |
49h16m |
160 |
3 |
Subcommittee on Agenda and Procedure (SCII) |
0 |
0 |
0 |
0 |
0h0m |
0 |
0 |
Justice and Human Rights (JUST) |
25 |
3 |
12 |
0 |
43h50m |
112 |
4 |
Subcommittee on Agenda and Procedure (SJUS) |
2 |
0 |
0 |
0 |
0h35m |
0 |
0 |
National Defence (NDDN) |
18 |
1 |
0 |
1 |
25h11m |
16 |
3 |
Subcommittee on Agenda and Procedure (SNDD) |
1 |
0 |
0 |
0 |
1h50m |
0 |
0 |
Natural Resources (RNNR) |
15 |
3 |
6 |
0 |
21h18m |
45 |
2 |
Subcommittee on Agenda and Procedure (SRNN) |
0 |
0 |
0 |
0 |
0h0m |
0 |
0 |
Official Languages (LANG) |
19 |
3 |
2 |
0 |
32h57m |
49 |
2 |
Subcommittee on Agenda and Procedure (SLAN) |
2 |
0 |
0 |
0 |
1h44m |
0 |
0 |
Procedure and House Affairs (PROC) |
26 |
3 |
1 |
0 |
43h07m |
66 |
16 |
Subcommittee on Agenda and Procedure (SPRO) |
1 |
0 |
0 |
0 |
0h30m |
0 |
0 |
Subcommittee on Private Members’ Business (SMEM) |
1 |
0 |
0 |
0 |
0h01m |
0 |
0 |
Subcommittee on the Code of Conduct for Members of the House of Commons: Sexual Harassment (SCCC) |
0 |
0 |
0 |
0 |
0h0m |
0 |
0 |
Public Accounts (PACP) |
19 |
10 |
0 |
2 |
30h00m |
65 |
9 |
Subcommittee on Agenda and Procedure (SPAC) |
0 |
0 |
0 |
0 |
0h0m |
0 |
0 |
Public Safety and National Security (SECU) |
23 |
12 |
2 |
1 |
40h11m |
96 |
6 |
Subcommittee on Agenda and Procedure (SSEC) |
5 |
0 |
0 |
0 |
2h49m |
0 |
0 |
Status of Women (FEWO) |
18 |
1 |
6 |
0 |
29h15m |
77 |
5 |
Subcommittee on Agenda and Procedure (SFEW) |
0 |
0 |
0 |
0 |
0h0m |
0 |
0 |
Transport, Infrastructure and Communities (TRAN) |
19 |
5 |
6 |
1 |
35h19m |
126 |
4 |
Subcommittee on Agenda and Procedure (STRA) |
2 |
0 |
0 |
0 |
1h54m |
0 |
0 |
Veterans Affairs (ACVA) |
16 |
2 |
3 |
0 |
18h55m |
38 |
3 |
Subcommittee on Agenda and Procedure (SACV) |
1 |
0 |
0 |
0 |
1h11m |
0 |
0 |
Liaison (LIAI) |
4 |
0 |
0 |
0 |
2h24m |
5 |
3 |
Subcommittee on Committee Budgets (SBLI) |
4 |
0 |
0 |
0 |
0h23m |
0 |
0 |
Subcommittee on Communications Activities in Relation to Committees (SLCO) |
0 |
0 |
0 |
0 |
0h0m |
0 |
0 |
Total |
582 |
146 |
137 |
11 |
955h18m |
2,375 |
121 |
Standing Joint Committees and Subcommittees
Standing Joint Committees and Subcommittees |
Total Number of Meetings |
Number of Televised Meetings |
Number of Meetings with Video-conferencing |
Number of Meetings with Video Recording |
Total Meeting Hours |
Number of Witnesses |
Number of Reports |
Library of Parliament (BILI) |
1 |
0 |
0 |
0 |
1h23m |
8 |
1 |
Scrutiny and Regulations (REGS) |
6 |
0 |
0 |
0 |
7h45m |
12 |
0 |
Subcommittee on Agenda and Procedure (SREG) |
0 |
0 |
0 |
0 |
0h0m |
0 |
0 |
Total |
7 |
0 |
0 |
0 |
9h08m |
20 |
1 |
Special Committee and Subcommittee
Special Committee and Subcommittee |
Total Number of Meetings |
Number of Televised Meetings |
Number of Meetings with Video-conferencing |
Number of Meetings with Video Recording |
Total Meeting Hours |
Number of Witnesses |
Number of Reports |
Canada-China Relations (CACN) |
8 |
5 |
5 |
0 |
17h02m |
31 |
1 |
Subcommittee on Agenda and Procedure (SCAC) |
4 |
0 |
0 |
0 |
3h39m |
0 |
0 |
Total |
12 |
5 |
5 |
0 |
20h41m |
31 |
1 |
All Committees
All Committees |
Total Number of Meetings |
Number of Televised Meetings |
Number of Meetings with Video-conferencing |
Number of Meetings with Video Recording |
Total Meeting Hours |
Number of Witnesses |
Number of Reports |
Total Standing Committees and Subcommittees |
582 |
146 |
137 |
11 |
955h18m |
2 375 |
121 |
Total Standing Joint Committees and Subcommittees |
7 |
0 |
0 |
0 |
9h08m |
20 |
1 |
Total Special Committee and Subcommittee |
12 |
5 |
5 |
0 |
20h41m |
31 |
1 |
Grand Total |
601 |
151 |
142 |
11 |
985h07m |
2,426 |
123 |
Summary of Committee Expenditures (April 1, 2019 to March 31, 2020)
The following tables summarize committee expenditures for the period from April 1, 2019 to March 31, 2020. Expenditures are broken down by “Witness Expenses”, “Video Conferences”, “Other” and “Travel”. “Other” includes expenditures such as working meals, reports, professional services, audio-visual equipment and minor miscellaneous expenses. Committees are listed in alphabetical order. Differences in totals are due to rounding.
Standing Committees
Committee Name |
Witness Expenses ($) |
Video Conferences ($) |
Other ($) |
Travel ($) |
Total ($) |
Access to Information, Privacy And Ethics (ETHI) |
4,662 |
2,973 |
6,341 |
0 |
13,975 |
Agriculture and Agri-Food (AGRI) |
13,884 |
2,763 |
3,902 |
0 |
20,548 |
Canadian Heritage (CHPC) |
15,686 |
2,828 |
1,056 |
0 |
19,570 |
Citizenship and Immigration (CIMM) |
30,032 |
2,237 |
2,795 |
0 |
35,064 |
Environment and Sustainable Development (ENVI) |
8,481 |
3,242 |
827 |
0 |
12,550 |
Finance (FINA) |
29,945 |
4,862 |
10,087 |
0 |
44,894 |
Fisheries and Oceans (FOPO) |
21,986 |
10,048 |
3,134 |
0 |
35,168 |
Foreign Affairs and International Development (FAAE) |
28,753 |
8,290 |
12,775 |
0 |
49,819 |
Government Operations and Estimates (OGGO) |
14,435 |
3,610 |
1,179 |
0 |
19,224 |
Health (HESA) |
45,115 |
4,071 |
3,246 |
40,383 |
92,815 |
Human Resources, Skills and Social Development and the Status of Persons with Disabilities (HUMA) |
1,962 |
950 |
4,557 |
0 |
7,469 |
Indigenous and Northern Affairs (INAN) |
39,272 |
3,565 |
5,382 |
0 |
48,219 |
Industry, Science and Technology (INDU) |
6,688 |
929 |
3,577 |
0 |
11,194 |
International Trade (CIIT) |
67,482 |
9,032 |
5,811 |
37,529 |
119,855 |
Justice and Human Rights (JUST) |
35,798 |
8,007 |
6,201 |
0 |
50,007 |
National Defence (NDDN) |
1,039 |
0 |
2,079 |
515 |
3,633 |
Natural Resources (RNNR) |
4,071 |
2,576 |
1,490 |
0 |
8,137 |
Official Languages (LANG) |
4,415 |
581 |
5,405 |
0 |
10,401 |
Procedure and House Affairs (PROC) |
749 |
0 |
6,258 |
0 |
7,007 |
Public Accounts (PACP) |
0 |
0 |
4,160 |
11,336 |
15,496 |
Public Safety and National Security (SECU) |
4,586 |
811 |
1,997 |
0 |
7,394 |
Status of Women (FEWO) |
16,260 |
4,412 |
4,711 |
0 |
25,383 |
Transport, Infrastructure and Communities (TRAN) |
17,520 |
2,009 |
4,283 |
0 |
23,811 |
Veterans Affairs (ACVA) |
3,688 |
850 |
1,561 |
0 |
6,098 |
Liaison (LIAI) |
0 |
0 |
1,154 |
0 |
1,154 |
Total |
416,508 |
78,645 |
103,967 |
89,763 |
688,884 |
Standing Joint Committees
Committee Name |
Witness Expenses ($) |
Video Conferences ($) |
Other ($) |
Travel ($) |
Total ($) |
Library of Parliament (BILI) |
0 |
0 |
290 |
0 |
290 |
Scrutiny of Regulations (REGS) |
0 |
0 |
1,090 |
0 |
1,090 |
Total |
0 |
0 |
1,380 |
0 |
1,380 |
Special Committee
Committee Name |
Witness Expenses ($) |
Video Conferences ($) |
Other ($) |
Travel ($) |
Total ($) |
Canada-China Relations (CACN) |
5,857 |
4,421 |
2,259 |
0 |
12,536 |
Total |
5,857 |
4,421 |
2,259 |
0 |
12,536 |
All Committees
Committee Name |
Witness Expenses ($) |
Video Conferences ($) |
Other ($) |
Travel ($) |
Total ($) |
Total Standing Committees |
416,508 |
78,645 |
103,967 |
89,763 |
688,884 |
Total Standing Joint Committees |
0 |
0 |
1,380 |
0 |
1,380 |
Total Special Committee |
5,857 |
4,421 |
2,259 |
0 |
12,536 |
Grand Total |
422,365 |
83,066 |
107,606 |
89,763 |
702,800 |
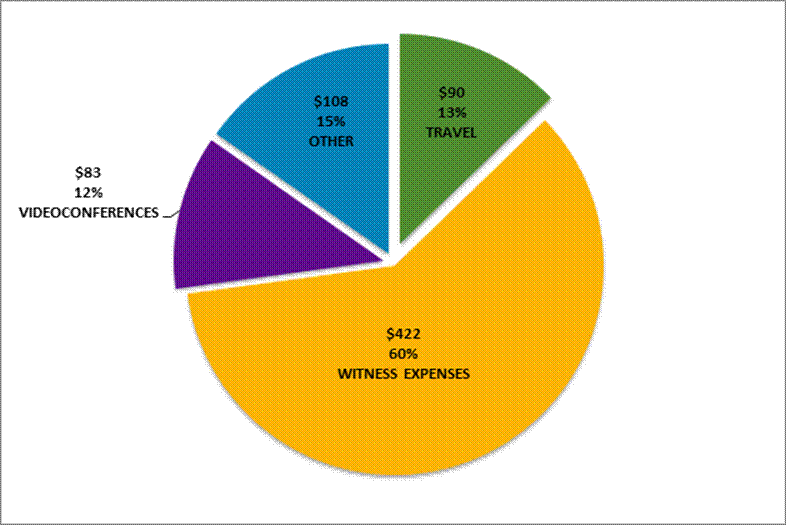
Breakdown of Committee Expenditures for All Committees (April 1, 2019 to March 31, 2020)
The following figure shows the total expenditures for all committees from April 1, 2019 to March 31, 2020, broken down by “Witness Expenses”, “Videoconferences”, “Other” and “Travel”. “Other” includes expenditures such as working meals, reports, professional services, audio-visual equipment and minor miscellaneous expenses.
Figure 1 – Breakdown of Committee Expenditures by Type of Expenditure for all Committees (in thousands of dollars)
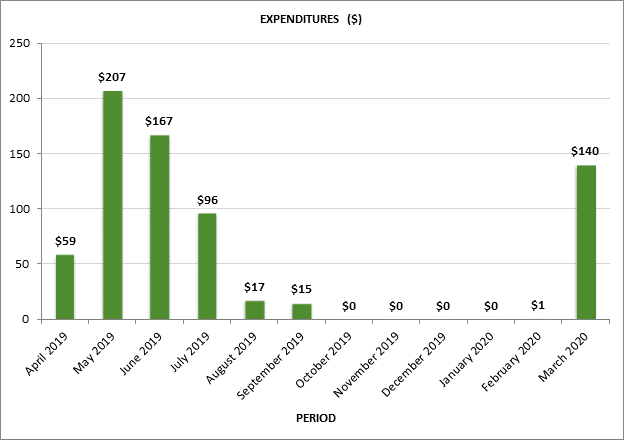
Breakdown of Committee Expenditures by Month for All Committees (April 1, 2019 to March 31, 2020)
The following figure shows total committee expenditures in each month from April 1, 2019 to March 31, 2020.
Figure 2 – Breakdown of Committee Expenditures by Month for all Committees (in thousands of dollars)
Committee Expenditures for the Last Five Fiscal Years
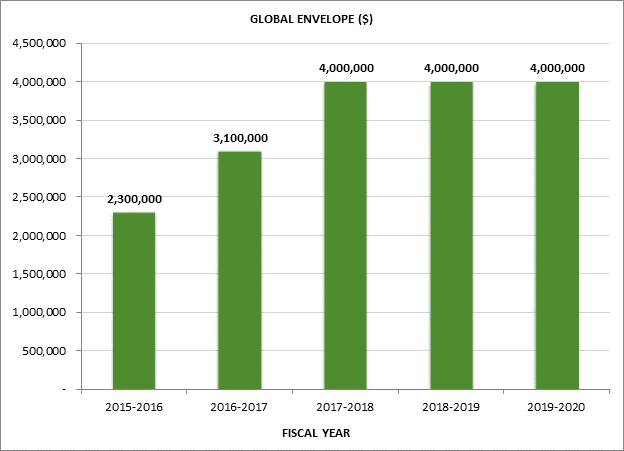
Comparison of the Global Envelope for Committees
The Board of Internal Economy determines the budget envelope or global envelope for standing and standing joint committee activities in each fiscal year. The following table and figure show the funds in the global envelope for each of the last five fiscal years. The global envelope does not include any amounts provided for special and legislative committees in any fiscal year, as these types of committees are funded directly by the Board of Internal Economy through separate processes. As per the February 23, 2017, decision of the Board of Internal Economy, funds for e-consultation services and expert resources were transferred to the overall global envelope and removed as a separate category.
Global Envelope for Committees for the Last Five Fiscal Years
Global Envelope Funding Type |
Fiscal Year 2015-2016 ($) |
Fiscal Year 2016-2017 ($) |
Fiscal Year 2017-2018 ($) |
Fiscal Year 2018-2019 ($) |
Fiscal Year 2019-2020 ($) |
Core Funding |
2,050,000 |
3,100,000 |
4,000,000 |
4,000,000 |
4,000,000 |
E-Consultation Services and Expert Resources |
250,000 |
0 |
0 |
0 |
0 |
Initial operating and equipment costs related to the webcasting of committee meetings |
1,500,000 |
||||
Total |
2,300,000 |
3,100,000 |
4,000,000 |
4,000,000 |
2,500,000 |
Figure 3 – Comparison of the Global Envelope for the Last Five Fiscal Years
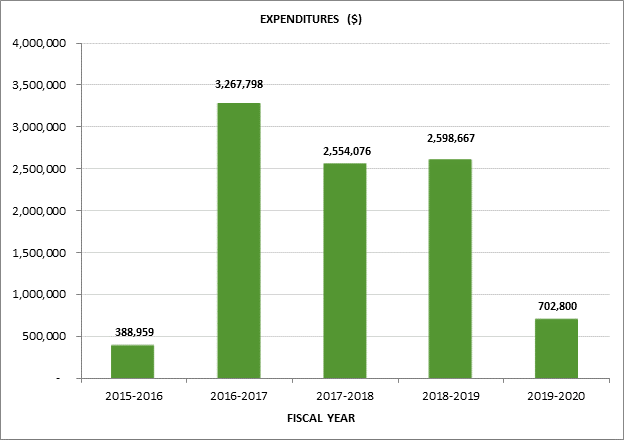
Comparison of Committee Expenditures
The following table and figure show the total expenditures by all committees in each of the last five fiscal years. Expenditures for standing and standing joint committees are covered by the global envelope for committee activities, allocated by the Board of Internal Economy and managed by the Liaison Committee. Expenditures for legislative, special and special joint committees are covered by funds approved by the Board of Internal Economy. Standing committee expenditures include all expenditures by any related subcommittees. Differences in totals are due to rounding.
Committee Expenditures for the Last Five Fiscal Years
Committee Type |
Fiscal Year 2015-2016 ($) |
Fiscal Year 2016-2017 ($) |
Fiscal Year 2017-2018 ($) |
Fiscal Year 2018-2019 ($) |
Fiscal Year 2019-2020 ($) |
Standing |
365,902 |
2,654,793 |
2,553,439 |
2,598,667 |
690,264 |
Legislative |
0 |
0 |
0 |
0 |
0 |
Special |
702 |
613,004 |
637 |
0 |
12,536 |
Special Joint |
22,355 |
0 |
0 |
0 |
0 |
Total |
388,959 |
3,267,798 |
2,554,076 |
2,598,667 |
702,800 |
Figure 4 – Comparison of Total Committee Expenditures of All Committees for the Last Five Fiscal Years
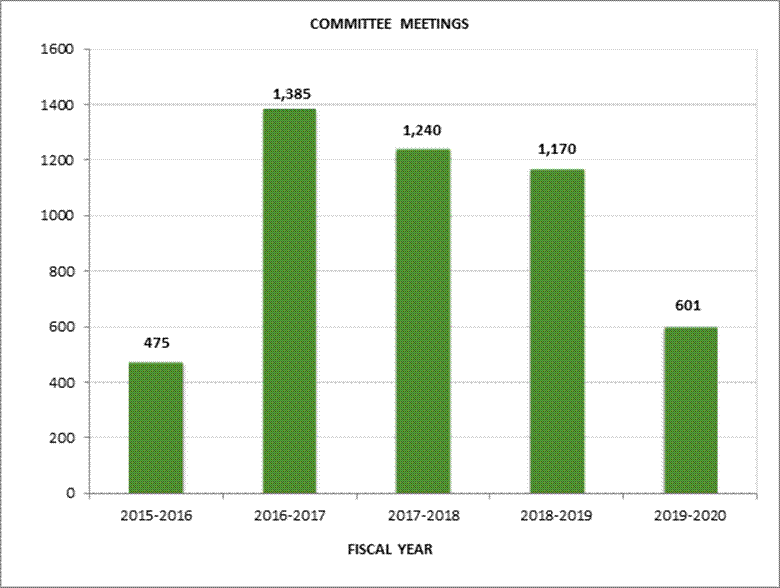
Committee Activities for the Last Five Fiscal Years
Committee Meetings
The following table and figure show the number of committee meetings by type of committee in each of the last five fiscal years.
Committee Type |
Meetings in Fiscal Year 2015-2016 |
Meetings in Fiscal Year 2016-2017 |
Meetings in Fiscal Year 2017-2018 |
Meetings in Fiscal Year 2018-2019 |
Meetings in Fiscal Year 2019-2020 |
Standing |
457 |
1,311 |
1,240 |
1,170 |
589 |
Legislative |
0 |
0 |
0 |
0 |
0 |
Special |
2 |
74 |
0 |
0 |
12 |
Special Joint |
16 |
0 |
0 |
0 |
0 |
Total |
475 |
1,385 |
1,240 |
1,170 |
601 |
Figure 5 – Comparison of the Total Number of Committee Meetings for All Committees for the Last Five Fiscal Years
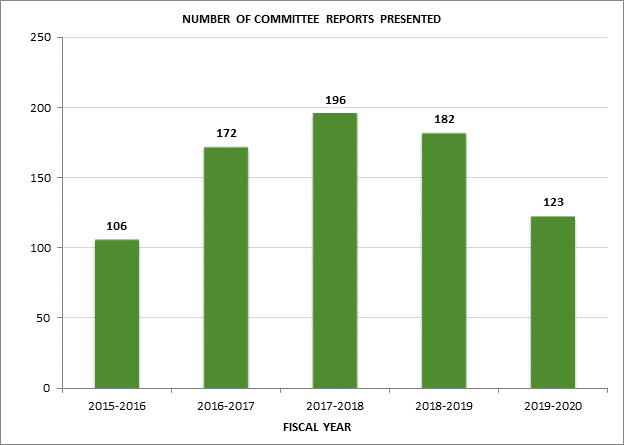
Committee Reports
The following table and figure show the number of committee reports by type of committee in each of the last five fiscal years.
Committee Type |
Reports in Fiscal Year 2015-2016 |
Reports in Fiscal Year 2016-2017 |
Reports in Fiscal Year 2017-2018 |
Reports in Fiscal Year 2018-2019 |
Reports in Fiscal Year 2019-2020 |
Standing |
105 |
169 |
196 |
182 |
122 |
Legislative |
0 |
0 |
0 |
0 |
0 |
Special |
0 |
3 |
0 |
0 |
1 |
Special Joint |
1 |
0 |
0 |
0 |
0 |
Total |
106 |
172 |
196 |
182 |
123 |
Figure 6 – Comparison of the Total Number of Committee Reports for All Committees for the Last Five Fiscal Years
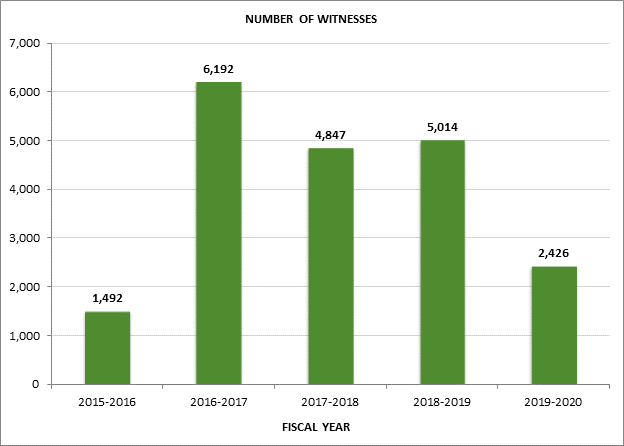
Committee Witnesses
The following table and figure show the number of witnesses by type of committee in each of the last five fiscal years.
Committee Type |
Witnesses in Fiscal Year 2015-2016 |
Witnesses in Fiscal Year 2016-2017 |
Witnesses in Fiscal Year 2017-2018 |
Witnesses in Fiscal Year 2018-2019 |
Witnesses in Fiscal Year 2019-2020 |
Standing |
1,429 |
5,381 |
4,847 |
5,014 |
2,395 |
Legislative |
0 |
0 |
0 |
0 |
0 |
Special |
2 |
811 |
0 |
0 |
31 |
Special Joint |
61 |
0 |
0 |
0 |
0 |
Total |
1,492 |
6,192 |
4,847 |
5,014 |
2,426 |
Figure 7 – Comparison of the Total Number of Witnesses for All Committees for the Last Five Fiscal Years
Committee Meetings by Type of Order of Reference
The following tables show the total number and percentage of meetings held by all committees in each of the last five fiscal years, broken down by type of order of reference. Meetings where more than one order of reference is considered are tabulated as a meeting for each type. Consequently, the total number of meetings by type may be greater than the total number of meetings held. Differences in totals are due to rounding.
Number of Committee Meetings by Type of Order of Reference
Reference Type |
Meetings in Fiscal Year 2015-2016 |
Meetings in Fiscal Year 2016-2017 |
Meetings in Fiscal Year 2017-2018 |
Meetings in Fiscal Year 2018-2019 |
Meetings in Fiscal Year 2019-2020 |
House Orders of Reference |
21 |
106 |
66 |
104 |
34 |
Standing Orders 108 (2), (3) and (4) |
287 |
1,033 |
884 |
842 |
304 |
Reports and Returns |
2 |
27 |
16 |
4 |
2 |
Estimates |
53 |
68 |
62 |
70 |
21 |
Order-in-Council Appointments |
3 |
2 |
18 |
8 |
0 |
Legislation |
43 |
109 |
179 |
158 |
36 |
Pre-budget Consultations |
11 |
19 |
18 |
19 |
10 |
Order Paper Written Questions |
0 |
0 |
0 |
0 |
0 |
Responses to Petitions |
0 |
0 |
0 |
0 |
0 |
Committee Business |
223 |
666 |
606 |
500 |
173 |
Election of Chairs and Vice-Chairs |
54 |
12 |
36 |
25 |
23 |
Others |
0 |
0 |
0 |
0 |
0 |
Total |
697 |
2,042 |
1,885 |
1,730 |
603 |
Percentage of Committee Meetings by Type of Order of Reference
Reference Type |
% of Meetings in Fiscal Year 2015-2016 |
% of Meetings in Fiscal Year 2016-2017 |
% of Meetings in Fiscal Year 2017-2018 |
% of Meetings in Fiscal Year 2018-2019 |
% of Meetings in Fiscal Year 2019-2020 |
House Orders of Reference |
3 |
5.2 |
3.5 |
6 |
5.6 |
Standing Orders 108 (2), (3) and (4) |
41.2 |
50.6 |
46.9 |
48.7 |
50.4 |
Reports and Returns |
0.3 |
1.3 |
0.8 |
0.2 |
0.3 |
Estimates |
7.6 |
3.3 |
3.3 |
4 |
3.5 |
Order-in-Council Appointments |
0.4 |
0.1 |
1 |
0.5 |
0 |
Legislation |
6.2 |
5.3 |
9.5 |
9.1 |
6 |
Pre-budget Consultations |
1.6 |
0.9 |
1 |
1.1 |
1.7 |
Order Paper Written Questions |
0 |
0 |
0 |
0 |
0 |
Responses to Petitions |
0 |
0 |
0 |
0 |
0 |
Committee Business |
32 |
32.6 |
32.1 |
28.9 |
28.7 |
Election of Chairs and Vice-Chairs |
7.7 |
0.6 |
1.9 |
1.4 |
3.8 |
Others |
0 |
0 |
0 |
0 |
0 |
Total |
100 |
100 |
100 |
100 |
100 |
Committee Reports by Type of Order of Reference
The following tables show the total number and percentage of reports by all committees in each of the last five fiscal years, broken down by type of order of reference. Reports presented under more than one order of reference are tabulated as a report for each type. Consequently, the total number of reports by type may be greater than the total number of reports. Differences in totals are due to rounding.
Number of Committee Reports by Type of Order of Reference
Reference Type |
Reports in Fiscal Year 2015-2016 |
Reports in Fiscal Year 2016-2017 |
Reports in Fiscal Year 2017-2018 |
Reports in Fiscal Year 2018-2019 |
Reports in Fiscal Year 2019-2020 |
House Orders of Reference |
4 |
6 |
8 |
7 |
8 |
Standing Orders 108 (2), (3) and (4) |
41 |
77 |
86 |
88 |
76 |
Reports and Returns |
0 |
3 |
3 |
0 |
0 |
Estimates |
35 |
38 |
39 |
32 |
14 |
Order-in-Council Appointments |
0 |
0 |
7 |
2 |
0 |
Legislation |
18 |
35 |
37 |
35 |
14 |
Pre-budget Consultations |
2 |
1 |
2 |
1 |
0 |
Order Paper Written Questions |
0 |
0 |
0 |
0 |
0 |
Responses to Petitions |
0 |
0 |
0 |
0 |
0 |
Committee Business |
2 |
3 |
4 |
3 |
3 |
Striking of Committee Membership |
5 |
9 |
10 |
14 |
8 |
Others |
0 |
0 |
0 |
0 |
0 |
Total |
107 |
172 |
196 |
182 |
123 |
Percentage of Committee Reports by Type of Order of Reference
Reference Type |
% of Reports in Fiscal Year 2015-2016 |
% of Reports in Fiscal Year 2016-2017 |
% of Reports in Fiscal Year 2017-2018 |
% of Reports in Fiscal Year 2018-2019 |
% of Reports in Fiscal Year 2019-2020 |
House Orders of Reference |
3.7 |
3.5 |
4.1 |
3.8 |
6.5 |
Standing Orders 108 (2), (3) and (4) |
38.3 |
44.8 |
43.9 |
48.4 |
61.8 |
Reports and Returns |
0 |
1.7 |
1.5 |
0 |
0 |
Estimates |
32.7 |
22.1 |
19.9 |
17.6 |
11.4 |
Order-in-Council Appointments |
0 |
0 |
3.6 |
1.1 |
0 |
Legislation |
16.8 |
20.3 |
18.9 |
19.2 |
11.4 |
Pre-budget Consultations |
1.9 |
0.6 |
1 |
0.5 |
0 |
Order Paper Written Questions |
0 |
0 |
0 |
0 |
0 |
Responses to Petitions |
0 |
0 |
0 |
0 |
0 |
Committee Business |
1.9 |
1.7 |
2 |
1.6 |
2.4 |
Striking of Committee Membership |
4.7 |
5.2 |
5.1 |
7.7 |
6.5 |
Others |
0 |
0 |
0 |
0 |
0 |
Total |
100 |
100 |
100 |
100 |
100 |