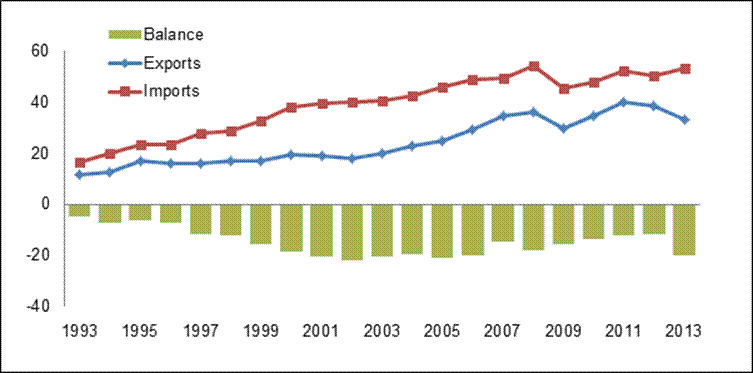
Figure 1 – Value of Canada’s Merchandise Trade with the
European Union,
1993–2013
($ billions)

Source: Industry Canada, Trade
Data Online.
Table 1 – Highest-valued Canadian Exports to, and Imports
from,
the European Union, 2013
($ billions)
Exports |
Imports |
Product |
Value |
Product |
Value |
Gold |
7.6 |
Medicaments |
4.4 |
Diamonds |
1.5 |
Motor vehicles |
4.3 |
Iron ores and concentrates |
1.5 |
Non-crude petroleum oils |
3.3 |
Uranium and other radioactive elements,
isotopes, residues and compounds |
1.3 |
Turbo-jets, turbo-propellers and other gas
turbines |
2.0 |
Turbo-jets, turbo-propellers and other gas
turbines |
1.2 |
Crude petroleum oils and oils obtained from
bituminous minerals |
1.2 |
Helicopters, airplanes and
spacecraft |
1.1 |
Parts of helicopters, airplanes, spacecraft
and other non-powered aircraft |
1.2 |
Non-crude petroleum oils |
1.0 |
Wine and grape must |
1.1 |
Medications |
0.9 |
Antiserum and other blood preparations |
0.9 |
Crude petroleum oils and oils obtained from
bituminous minerals |
0.8 |
Motor vehicle parts (excluding body,
chassis and engines) |
0.7 |
Nickel mattes, nickel oxide sinters and
other intermediate products of nickel metallurgy |
0.7 |
Parts for heavy machinery |
0.6 |
Note: This list is based on the Harmonized System (HS) 4-digit
product level.
Source: Industry Canada, Trade
Data Online.
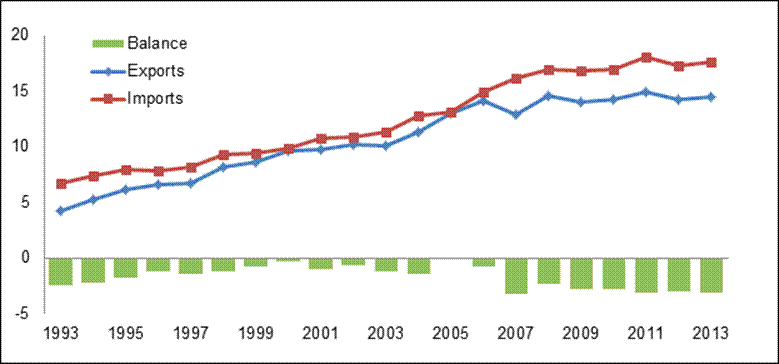
Figure 2 – Value of Canada’s Trade in Services with the
European Union,
1993–2013
($ billions)

Source: Foreign Affairs, Trade and Development Canada, Trade
Investment and Economic Statistics.
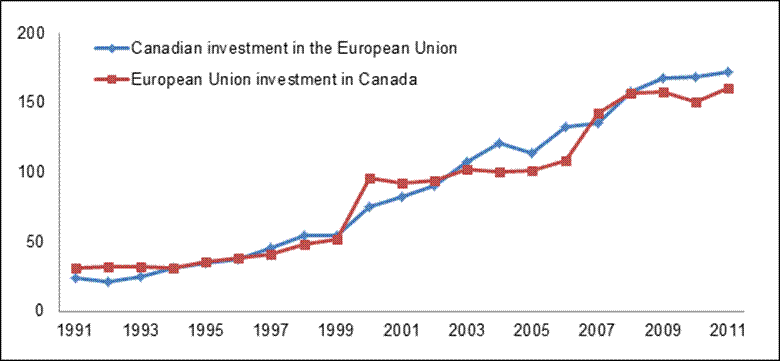
Figure 3 – Stock of Foreign Direct Investment, 1991–2011
($ billions)

Source: Foreign Affairs, Trade and Development Canada, Trade
Investment and Economic Statistics.
Table 2 – Thresholds Specified in the Technical Summary
of the Final Negotiated Outcomes for Various Types of Goods and Services to
be Procured by Government Entities of Canada and the European Union
Canada |
European Union |
Entity |
Threshold ($) |
Entity |
Threshold (€) |
Provinces and territories: government
entities, including municipalities, academia, school boards and hospitals |
315,000 |
European entities and central member-state
government entities |
130,000 |
Federal government |
205,000 |
Sub-central entities (regional and local
entities, as well as bodies governed by public law, including hospitals,
schools, universities and social services) |
200,000 |
Other government entities, including arms-length
and Crown entities of the federal, provincial and territorial governments |
560,000 |
Other sub-central entities |
355,000 |
Utilities sector (all governments) |
630,000 |
Utilities sector |
400,000 |
Construction services (all governments) |
7,800,000 |
Construction services (all entities) |
5,000,000 |
Note: Table 2 should be read in conjunction with the Technical
Summary of the Final Negotiated Outcomes, as there is a number of
exceptions and reservations. Dollar or euro amounts are based on the conversion
rates used in the Technical Summary of the Final Negotiated Outcomes.
Source: Governement of Canada, Technical
Summary of the Final Negotiated Outcomes.


