

CHAPTER I: BACKGROUND
A. THE COMMITTEE'S MANDATE
In September 1995, members of the House of Commons Standing Committee on Health decided to examine strategies that result in positive health outcomes for children. From the beginning, members heard that many adolescent and adult problems originated in early childhood and that many were preventable. They listened carefully as multiple witnesses asserted that children are Canada's most valuable resource and that investing in children would result in long-term benefits for the whole country. They received confirmation that, families as the primary caregivers for children, provide the major foundation for their physical, mental and emotional health. They also got frequent reinforcement for the view that communities and governments play a major role in securing a positive future for children.As a parliamentary committee, the members directed their attention primarily at the federal government. They recognise that the provincial governments have the primary jurisdiction over health but, within the accepted framework for federal, provincial, territorial co-operation, they envision joint efforts by all levels of government to ensure that government policies are child-centred, family-friendly and community-supportive. For them, the focus on the part of all levels of government - municipal, provincial/ territorial, and federal - must be to ensure that resources get to the children who need them.
Accordingly, the following terms of reference guided their work:
- To receive evidence on existing and emerging approaches aimed at ensuring healthy developmental outcomes for children under 6 years of age:
- To examine ways that families, communities and governments contribute to the positive physical, mental and emotional development of young children;
- To make appropriate recommendations on the most effective measures for future action.
B. CANADA'S CHILDREN
The Committee recognises that Canada's children represent the country's future and that it is important to provide all the resources needed to ensure their proper development. It understands that children must have a safe, nurturing family and community environment along with adequate socio-economic conditions if they are to develop to their full potential. Positive child development creates individuals better prepared for the society in which they live; equipped to deal with the stress of everyday life and able to take their own destiny in hand. In short, these children will have a healthier and more productive life.The Committee recognises that most Canadian children live in conditions conducive to healthy development and that their families and communities provide them with the guidance they need to grow. However, some of the facts presented to the Committee call for specific measures to improve Canada's ability to take on the challenges of tomorrow.
1. Communities
Statistics Canada estimates that there are currently almost 2.4 million children under the age of 6 in Canada, 51.3% of them boys and 48.7% of them girls. The under-6 age group makes up about 7.9% of the total population.The context - community, ethnic and family - in which children grow up has changed dramatically over the years. The concept of a small, close-knit community is not a reality for many families today. In 1995, more than 60% of children under 6 lived in one of Canada's 25 metropolitan areas, and of those, more than half lived in or around Toronto, Montreal or Vancouver. Moreover, ethnic diversity increases as urban populations grow. Over the last decade, almost 63% of new immigrants to Canada have settled in Toronto, Montreal or Vancouver, most of the rest in other metropolitan areas.
2. Family Structures
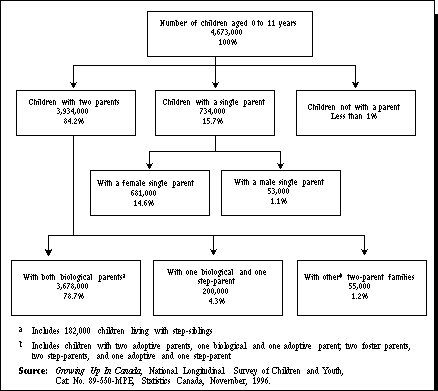
As Figure 1 shows, the family unit has also changed in Canada. Most children aged0 to 11 years live in two-parent families (84.2%): 78.7% with both biological parents and 5.5% in some other type of two-parent family. Slightly more than 15% of children live in a single-parent family; in most cases, the single parent is the mother (14.6% of all children aged 0 to 11).
Figure 1
Distribution of children aged 0 to 11 years by family type, 1994-95
The role of the mother in the family unit has also changed over the years. The employment rate among women with children under the age of 3 rose from 39% in 1981 to 57% in 1994. Moreover, the proportion of women with children between the ages of3 and 5 increased from 47% in 1981 to 59% in 1994. This increase in employment among women with young children is reflected in an increase in families where both parents work outside the home. Table 1 also shows that, in 1994-95, 57.3% of children aged 0 to 11 lived in a family where both parents worked outside the home, whereas a third lived in a family where only one parent worked outside the home. This is the reverse of the situation 30 years ago. The time parents spend at home has decreased considerably over the years.
Table 1
Distribution of children aged 0 to 11 years
by labour market status of parent(s), 1994-95
|
| ||
|
|
Two-parent families
(%) |
Single-parent families
(%) |
|
| ||
| Both full-time (except single-parent)
One full-time, one part-time One full-time, one none Part-time only(a) Not employed |
35.5
21.8 33.2 2.9 6.6 |
34.1
n/a n/a 10.9 54.9 |
|
| ||
- (a) Includes two-parent families where one parent is employed part-time and the other is
employed part-time or not employed
n/a not applicable
Source: Growing Up In Canada, National Longitudinal Survey of Children and Youth,Cat. No. 89-550-MPE, Statistics Canada, November, 1996.
The employment rate among single mothers with young children stands in sharp
contrast to the rate among other mothers. In 1994, 37% of single mothers whose
youngest child was under 6 were employed, compared with 57% of all mothers whose
youngest child was under 6. In addition to this information, Table 1 shows that more
than half of all children aged 0 to 11 years who lived in a single-parent family had a
parent not employed.
Employment is an important consideration in analysing the status of children. While a job takes up a significant portion of parents' time, it also allows parents to meet their children's most basic needs. These two elements are important because they show that parents who have to work longer hours to maintain a particular standard of living spend less time with their children. On the other hand, parents who are unemployed have trouble meeting the physical needs of their children, even before they are born.
The increase in the number of families where both parents work is reflected in the greater incidence of non-parental child care. As Table 2 shows, more than half of all children aged 0 to 17 months were cared for by someone other than a parent for at least part of the week in 1988. Two thirds of children aged 18 to 35 months and almost four out of five children between the ages of 3 and 5 received non-parental care. The average number of hours spent in non-parental care was more or less the same in all age groups, ranging from 22 hours (0 to 17 months) to 25 hours (18 to 25 months).
Table 2
Children in non-parental care, Canada, 1988
|
| ||
| Age
|
Children in non-parental care
|
Average number of hours spent in non-parental care (%) |
|
| ||
| 0 to 17 months
18 to 35 months 3 to 5 years |
55
64 79 |
22
25 24 |
|
| ||
- Source: Where are the Children? An Overview of Child Care Arrangements in Canada,Cat. No. 89-527E, Statistics Canada, March 1993
3. Poverty
However, although work takes up a considerable portion of parents' time, income from employment is crucial to the ability of families to meet the basic needs of children and ensure healthy child development. Children from disadvantaged backgrounds are more likely to experience poor physical and emotional health, academic problems and mental health problems.Table 3 shows the incidence of children with low birth weight based on family income and the impact of low birth weight on motor and social development. The figures indicate that low birth weight is more common among children of families with an income under $60,000. They also suggest that children who were underweight at birth are delayed in terms of motor and social development relative to normal-birth-weight children.
Table 3
Distribution of children aged 0 to 3 years by birth weight,
family
income, and motor and social development, 1994-95
|
| ||
|
|
Normal birth weight (>2,500 g) |
Low birth weight (<2,500 g) |
|
| ||
| Family income(a)
<$30,000 $30,000 - $60,000 >$60,000 |
93.5 93.7 95.8 |
6.5 6.3 4.3 | Motor and social development
Advanced Normal Delayed |
14.9 71.5 13.5 |
10.5 58.5 31.0 |
|
| ||
- (a) Distribution of children aged 0 to 3 years by family income
Source: Growing Up In Canada, National Longitudinal Survey of Children and Youth,Cat. No. 89-550-MPE, Statistics Canada, November, 1996.
Family income alone cannot account for the incidence of low birth weight or other health problems in babies. Other variables correlated with income, such as smoking during pregnancy or the parents' level of schooling, can also affect child health and development. The fact remains, however, that poverty among children has a significant impact on their health and, has risen to alarming proportions in Canada.
There is no official measurement of poverty in Canada. However, the low-income cutoff (LICO) as calculated by Statistics Canada is often used as a benchmark for measuring the poverty rate. Based on the LICO, poverty stood at 24.6% among children between the ages of 0 and 11 years in 1994-95 and 70.9% among children living with a single mother. Table 4 shows the number of poor children aged 0 to 11 years and the child poverty rate by type of family.
Table 4
Distribution of poor children and poverty rate among
children aged0 to 11 by type of family, 1994-95
|
| ||
|
|
Number of poor children | Poverty rate (%) |
|
| ||
| All children aged 0 to 11
Two-parent family Single-parent family female single parent male single parent
|
1,114,558
649,110 499,100 482,829 16,271
|
24.6
16.5 68.0 70.9 30.7
|
|
| ||
- (a) Poverty is measured using Statistics Canada's low-income cutoff (LICO)
Source: Growing Up In Canada, National Longitudinal Survey of Children and Youth,Cat. No. 89-550-MPE, Statistics Canada, November, 1996.
Poverty among children in Canada is especially troublesome when compared with the rate in other industrialized countries. The rate of child poverty in Canada after government redistribution is four times the rate in Sweden, twice as high as in France and Germany, and 1.4 times the rate in Great Britain. Only in the United States is the rate higher than in Canada.1
1 See Progress of Nations, 1996, UNICEF, page 45.